Documentation
Introduction
- Overview
- Getting Started
- Support for K8s Installers
- Deploying on Kind
- Deploying on Minikube
- Configuration
- Installing with Helm
Cloud Deployment
Reference
- Antrea Network Policy
- Antctl
- Architecture
- Traffic Encryption (Ipsec / WireGuard)
- Securing Control Plane
- Security considerations
- Troubleshooting
- OS-specific Known Issues
- OVS Pipeline
- Feature Gates
- Antrea Proxy
- Network Flow Visibility
- Traceflow Guide
- NoEncap and Hybrid Traffic Modes
- Egress Guide
- NodePortLocal Guide
- Antrea IPAM Guide
- Exposing Services of type LoadBalancer
- Traffic Control
- Versioning
- Antrea API Groups
- Antrea API Reference
Windows
Integrations
Cookbooks
Multicluster
Developer Guide
Project Information
Using Antrea with Fluentd
This guide will describe how to use Project Antrea with
Fluentd, in order for efficient audit logging. In this scenario, Antrea is used for the default network,
Elasticsearch is used for the default storage, and Kibana dashboard is used for visualization.
Prerequisites
The only prerequisites are:
- a K8s cluster (Linux Nodes) running a K8s version supported by Antrea.
-
kubectl
All the required software will be deployed using YAML manifests, and the corresponding container images will be downloaded from public registries.
Practical steps
Step 1: Deploying Antrea
For detailed information on the Antrea requirements and instructions on how to deploy Antrea, please refer to
getting-started.md. To deploy the latest version of Antrea, use:
kubectl apply -f https://raw.githubusercontent.com/antrea-io/antrea/main/build/yamls/antrea.yml
You may also choose a released Antrea version.
Step 2: Deploy Elasticsearch and Kibana Dashboard
Fluentd supports multiple
output plugins.
Details will be discussed in
Step 4, but
by default, log records are collected by Fluentd DaemonSet and sent to Elasticsearch.
A Kibana Dashboard can then be used to visualize the data. The YAML file for
deployment is included in the resources directory. To deploy Elasticsearch
and Kibana, run:
kubectl apply -f docs/cookbooks/fluentd/resources/kibana-elasticsearch.yml
Step 3: Configure Custom Fluentd Plugins
The architecture of Fluentd is a pipeline from input-> parser-> buffer-> output-> formatter, many of these are plugins that could be configured to fit users’ different use cases.
To specify custom input plugins and parsers, modify ./resources/kubernetes.conf
and create a ConfigMap with the following command. Later, direct Fluentd
DaemonSet to refer to that ConfigMap. To see more variations of custom
configuration, refer to
Fluentd inputs.
This cookbook uses the
tail
input plugin to monitor the audit logging files for Antrea-native policies
on every K8s Node.
kubectl create configmap fluentd-conf --from-file=docs/cookbooks/fluentd/resources/kubernetes.conf --namespace=kube-logging
Step 4: Deploy Fluentd DaemonSet
Fluentd deployment includes RBAC and DaemonSet. Fluentd will collect logs
from cluster components, so permissions need to be granted first through
RBAC. In fluentd.yml, we create a ServiceAccount, and use a ClusterRole
and a ClusterRoleBinding to grant it permissions to read, list and watch
Pods in cluster scope.
In the DaemonSet configuration, specify Elasticsearch host, port and scheme,
as they are required by the Elasticsearch output plugin.
In
Fluentd official documentation,
output plugins are specified in fluent.conf depending on the chosen image.
To change output plugins, choose a different image and specify it in ./resources/fluentd.yml.
When choosing image version, note that the current Elasticsearch version
specified in resources/kibana-elasticsearch.yml is 7.8.0 and that the major
Elasticsearch version must match between the 2 files.
kubectl apply -f docs/cookbooks/fluentd/resources/fluentd.yml
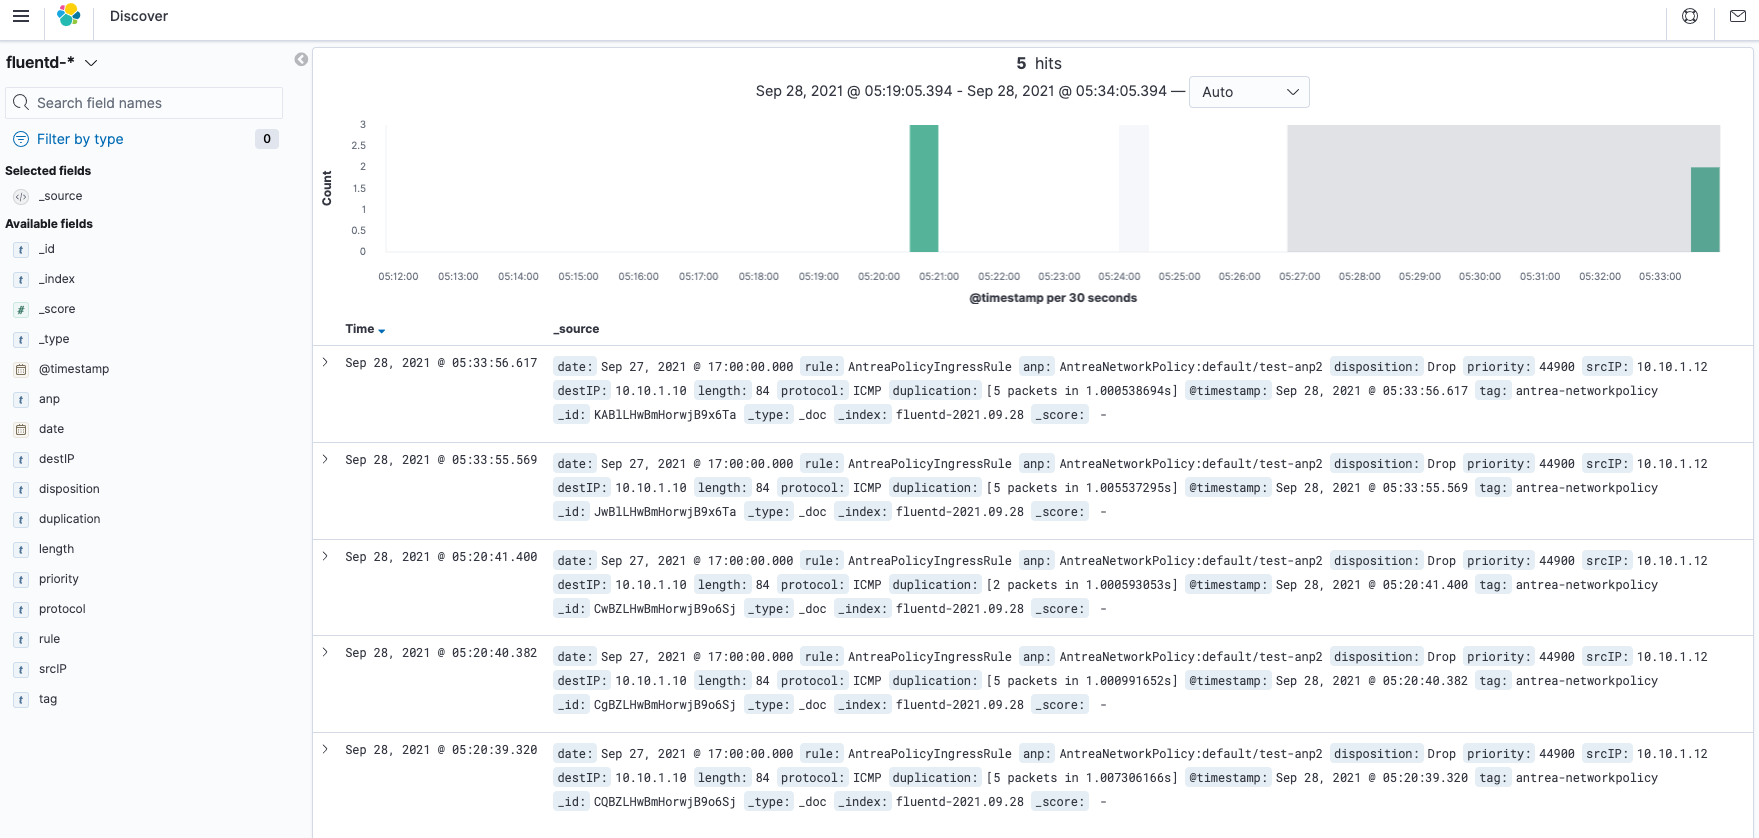
Step 5: Visualize with Kibana Dashboard
Navigate to http://[NodeIP]: 30007 and create an index pattern with “fluentd-*”.
Go to http://[NodeIP]: 30007/app/kibana#/discover to see the results as below.
Email Alerting
Kibana dashboard supports creating alerts with the logs in this
guide. This
documentation also provides a detailed guide for email alerting when using td-agent (the stable version of Fluentd and preconfigured).
For this cookbook with custom Fluentd configuration, modify and add the following
code to ./resources/kubernetes.conf, then update ConfigMap in
Step 3: Configure Custom Fluentd Plugins.
<match antrea-networkpolicy>
  @type grepcounter
  count_interval 3  # The time window for counting errors (in secs)
  input_key code    # The field to apply the regular expression
  regexp ^5\d\d$    # The regular expression to be applied
  threshold 1       # The minimum number of erros to trigger an alert
  add_tag_prefix error_ANPxx  # Generate tags like "error_ANPxx.antrea-networkpolicy"
</match>
<match error_5xx.antrea-networkpolicy>
@type copy

<store>
@type stdout  # Print to stdout for debugging
</store>
<store>
@type mail
host smtp.gmail.com        # Change this to your SMTP server host
port 587                   # Normally 25/587/465 are used for submission
user USERNAME              # Use your username to log in
password PASSWORD          # Use your login password
enable_starttls_auto true  # Use this option to enable STARTTLS
from
example@antrea.com    # Set the sender address
to
alert@example.com       # Set the recipient address
subject ‘Antrea Native Policy Error’
message Total ANPxx error count: %s\n\nPlease check Antrea Native Policy feature ASAP
message_out_keys count     # Use the "count" field to replace "%s" above
</store>
</match>