Documentation
Introduction
- Overview
- Getting Started
- Support for K8s Installers
- Deploying on Kind
- Deploying on Minikube
- Configuration
Cloud Deployment
Reference
- Antrea Network Policy
- Antctl
- Architecture
- Traffic Encryption (Ipsec / WireGuard)
- Securing Control Plane
- Security considerations
- Troubleshooting
- OS-specific Known Issues
- OVS Pipeline
- Feature Gates
- Antrea Proxy
- Network Flow Visibility
- Traceflow Guide
- NoEncap and Hybrid Traffic Modes
- Egress Guide
- NodePortLocal Guide
- Antrea IPAM Guide
- Exposing Services of type LoadBalancer
- Versioning
- Antrea API Groups
- Antrea API Reference
Windows
Integrations
Cookbooks
Multicluster
Developer Guide
Project Information
Network Flow Visibility in Antrea
Table of Contents
- Overview
- Flow Exporter
- Flow Aggregator
- Quick Deployment
- Flow Collectors
Overview
Antrea is a Kubernetes network plugin that provides network connectivity and security features for Pod workloads. Considering the scale and dynamism of Kubernetes workloads in a cluster, Network Flow Visibility helps in the management and configuration of Kubernetes resources such as Network Policy, Services, Pods etc., and thereby provides opportunities to enhance the performance and security aspects of Pod workloads.
For visualizing the network flows, Antrea monitors the flows in Linux conntrack module. These flows are converted to flow records, and then flow records are post-processed before they are sent to the configured external flow collector. High-level design is given below:

Flow Exporter
In Antrea, the basic building block for the Network Flow Visibility is the Flow Exporter. Flow Exporter operates within Antrea Agent; it builds and maintains a connection store by polling and dumping flows from conntrack module periodically. Connections from the connection store are exported to the Flow Aggregator Service using the IPFIX protocol, and for this purpose we use the IPFIX exporter process from the go-ipfix library.
Configuration
To enable the Flow Exporter feature at the Antrea Agent, the following config parameters have to be set in the Antrea Agent ConfigMap:
  antrea-agent.conf: |
    # FeatureGates is a map of feature names to bools that enable or disable experimental features.
    featureGates:
    # Enable flowexporter which exports polled conntrack connections as IPFIX flow records from each agent to a configured collector.
      FlowExporter: true

    # Provide the IPFIX collector address as a string with format <HOST>:[<PORT>][:<PROTO>].
    # HOST can either be the DNS name or the IP of the Flow Collector. For example,
    # "flow-aggregator.flow-aggregator.svc" can be provided as a DNS name to connect
    # to the Antrea Flow Aggregator Service. If IP, it can be either IPv4 or IPv6.
    # However, IPv6 address should be wrapped with [].
    # If PORT is empty, we default to 4739, the standard IPFIX port.
    # If no PROTO is given, we consider "tls" as default. We support "tls", "tcp" and
    # "udp" protocols. "tls" is used for securing communication between flow exporter and
    # flow aggregator.
    #flowCollectorAddr: "flow-aggregator.flow-aggregator.svc:4739:tls"

    # Provide flow poll interval as a duration string. This determines how often the
    # flow exporter dumps connections from the conntrack module. Flow poll interval
    # should be greater than or equal to 1s (one second).
    # Valid time units are "ns", "us" (or "µs"), "ms", "s", "m", "h".
    #flowPollInterval: "5s"

    # Provide the active flow export timeout, which is the timeout after which a flow
    # record is sent to the collector for active flows. Thus, for flows with a continuous
    # stream of packets, a flow record will be exported to the collector once the elapsed
    # time since the last export event is equal to the value of this timeout.
    # Valid time units are "ns", "us" (or "µs"), "ms", "s", "m", "h".
    #activeFlowExportTimeout: "60s"

    # Provide the idle flow export timeout, which is the timeout after which a flow
    # record is sent to the collector for idle flows. A flow is considered idle if no
    # packet matching this flow has been observed since the last export event.
    # Valid time units are "ns", "us" (or "µs"), "ms", "s", "m", "h".
    #idleFlowExportTimeout: "15s"
Please note that the default value for flowCollectorAddr is "flow-aggregator.flow-aggregator.svc:4739:tls",
which uses the DNS name of the Flow Aggregator Service, if the Service is deployed
with the Name and Namespace set to flow-aggregator. For Antrea Agent running on
a Windows node, the user is required to change the default value of HOST in flowCollectorAddr
from DNS name to the Cluster IP of the Flow Aggregator Service. The reason is because
on Windows the Antrea Agent runs as a process, it uses the host’s default DNS setting and the DNS
resolver will not be configured to talk to the CoreDNS Service for cluster local DNS queries like
flow-aggregator.flow-aggregator.svc. In addition, if you deploy the Flow Aggregator Service
with a different Name and Namespace, then either use the appropriate DNS name or the Cluster IP of
the Service.
Please note that the default values for
flowPollInterval, activeFlowExportTimeout, and idleFlowExportTimeout parameters are set to 5s, 60s, and 15s, respectively.
TLS communication between the Flow Exporter and the Flow Aggregator is enabled by default.
Please modify them as per your requirements.
IPFIX Information Elements (IEs) in a Flow Record
There are 34 IPFIX IEs in each exported flow record, which are defined in the IANA-assigned IE registry, the Reverse IANA-assigned IE registry and the Antrea IE registry. The reverse IEs are used to provide bi-directional information about the flow. The Enterprise ID is 0 for IANA-assigned IE registry, 29305 for reverse IANA IE registry, 56505 for Antrea IE registry. All the IEs used by the Antrea Flow Exporter are listed below:
IEs from IANA-assigned IE Registry
| IPFIX Information Element | Field ID | Type |
|---|---|---|
| flowStartSeconds | 150 | dateTimeSeconds |
| flowEndSeconds | 151 | dateTimeSeconds |
| flowEndReason | 136 | unsigned8 |
| sourceIPv4Address | 8 | ipv4Address |
| destinationIPv4Address | 12 | ipv4Address |
| sourceIPv6Address | 27 | ipv6Address |
| destinationIPv6Address | 28 | ipv6Address |
| sourceTransportPort | 7 | unsigned16 |
| destinationTransportPort | 11 | unsigned16 |
| protocolIdentifier | 4 | unsigned8 |
| packetTotalCount | 86 | unsigned64 |
| octetTotalCount | 85 | unsigned64 |
| packetDeltaCount | 2 | unsigned64 |
| octetDeltaCount | 1 | unsigned64 |
IEs from Reverse IANA-assigned IE Registry
| IPFIX Information Element | Field ID | Type |
|---|---|---|
| reversePacketTotalCount | 86 | unsigned64 |
| reverseOctetTotalCount | 85 | unsigned64 |
| reversePacketDeltaCount | 2 | unsigned64 |
| reverseOctetDeltaCount | 1 | unsigned64 |
IEs from Antrea IE Registry
| IPFIX Information Element | Field ID | Type | Description |
|---|---|---|---|
| sourcePodNamespace | 100 | string | |
| sourcePodName | 101 | string | |
| destinationPodNamespace | 102 | string | |
| destinationPodName | 103 | string | |
| sourceNodeName | 104 | string | |
| destinationNodeName | 105 | string | |
| destinationClusterIPv4 | 106 | ipv4Address | |
| destinationClusterIPv6 | 107 | ipv6Address | |
| destinationServicePort | 108 | unsigned16 | |
| destinationServicePortName | 109 | string | |
| ingressNetworkPolicyName | 110 | string | Name of the ingress network policy applied to the destination Pod for this flow. |
| ingressNetworkPolicyNamespace | 111 | string | Namespace of the ingress network policy applied to the destination Pod for this flow. |
| ingressNetworkPolicyType | 115 | unsigned8 | 1 stands for Kubernetes Network Policy. 2 stands for Antrea Network Policy. 3 stands for Antrea Cluster Network Policy. |
| ingressNetworkPolicyRuleName | 141 | string | Name of the ingress network policy Rule applied to the destination Pod for this flow. |
| egressNetworkPolicyName | 112 | string | Name of the egress network policy applied to the source Pod for this flow. |
| egressNetworkPolicyNamespace | 113 | string | Namespace of the egress network policy applied to the source Pod for this flow. |
| egressNetworkPolicyType | 118 | unsigned8 | |
| egressNetworkPolicyRuleName | 142 | string | Name of the egress network policy rule applied to the source Pod for this flow. |
| ingressNetworkPolicyRuleAction | 139 | unsigned8 | 1 stands for Allow. 2 stands for Drop. 3 stands for Reject. |
| egressNetworkPolicyRuleAction | 140 | unsigned8 | |
| tcpState | 136 | string | The state of the TCP connection. The states are: LISTEN, SYN-SENT, SYN-RECEIVED, ESTABLISHED, FIN-WAIT-1, FIN-WAIT-2, CLOSE-WAIT, CLOSING, LAST-ACK, TIME-WAIT, and CLOSED. |
| flowType | 137 | unsigned8 | 1 stands for Intra-Node. 2 stands for Inter-Node. 3 stands for To External. 4 stands for From External. |
Supported Capabilities
Types of Flows and Associated Information
Currently, the Flow Exporter feature provides visibility for Pod-to-Pod, Pod-to-Service and Pod-to-External network flows along with the associated statistics such as data throughput (bits per second), packet throughput (packets per second), cumulative byte count and cumulative packet count. Pod-To-Service flow visibility is supported only when Antrea Proxy enabled, which is the case by default starting with Antrea v0.11. In the future, we will enable the support for External-To-Service flows.
Kubernetes information such as Node name, Pod name, Pod Namespace, Service name, NetworkPolicy name and NetworkPolicy Namespace, is added to the flow records. Network Policy Rule Action (Allow, Reject, Drop) is also supported for both Antrea-native NetworkPolicies and K8s NetworkPolicies. For K8s NetworkPolicies, connections dropped due to isolated Pod behavior will be assigned the Drop action. For flow records that are exported from any given Antrea Agent, the Flow Exporter only provides the information of Kubernetes entities that are local to the Antrea Agent. In other words, flow records are only complete for intra-Node flows, but incomplete for inter-Node flows. It is the responsibility of the Flow Aggregator to correlate flows from the source and destination Nodes and produce complete flow records.
Both Flow Exporter and Flow Aggregator are supported in IPv4 clusters, IPv6 clusters and dual-stack clusters.
Connection Metrics
We support following connection metrics as Prometheus metrics that are exposed
through
Antrea Agent apiserver endpoint:
antrea_agent_conntrack_total_connection_count,
antrea_agent_conntrack_antrea_connection_count,
antrea_agent_denied_connection_count,
antrea_agent_conntrack_max_connection_count, and
antrea_agent_flow_collector_reconnection_count
Flow Aggregator
Flow Aggregator is deployed as a Kubernetes Service. The main functionality of Flow Aggregator is to store, correlate and aggregate the flow records received from the Flow Exporter of Antrea Agents. More details on the functionality are provided in the Supported Capabilities section.
Flow Aggregator is implemented as IPFIX mediator, which consists of IPFIX Collector Process, IPFIX Intermediate Process and IPFIX Exporter Process. We use the go-ipfix library to implement the Flow Aggregator.
Deployment
To deploy a released version of Flow Aggregator Service, pick a deployment manifest from the
list of releases. For any
given release <TAG> (e.g. v0.12.0), you can deploy Flow Aggregator as follows:
kubectl apply -f https://github.com/antrea-io/antrea/releases/download/<TAG>/flow-aggregator.yml
To deploy the latest version of Flow Aggregator Service (built from the main branch), use the checked-in deployment yaml:
kubectl apply -f https://raw.githubusercontent.com/antrea-io/antrea/main/build/yamls/flow-aggregator.yml
Configuration
The following configuration parameters have to be provided through the Flow
Aggregator ConfigMap. Flow aggregator needs to be configured with at least one
of the supported
Flow Collectors.
flowCollector is mandatory for
go-ipfix collector, and
clickHouse is mandatory for
Grafana Flow Collector.
We provide an example value for this parameter in the following snippet.
- If you have deployed the
go-ipfix collector,
then please set
flowCollector.enabletotrueand use the address forflowCollector.address:<Ipfix-Collector Cluster IP>:<port>:<tcp|udp> - If you have deployed the
Grafana Flow Collector,
then please enable the collector by setting
clickHouse.enabletotrue. If it is deployed following the deployment steps, the ClickHouse server is already exposed via a K8s Service, and no further configuration is required. If a different FQDN or IP is desired, please use the URL forclickHouse.databaseURLin the following format:tcp://<ClickHouse server FQDN or IP>:<ClickHouse TCP port>.
flow-aggregator.conf: |
  # Provide the active flow record timeout as a duration string. This determines
  # how often the flow aggregator exports the active flow records to the flow
  # collector. Thus, for flows with a continuous stream of packets, a flow record
  # will be exported to the collector once the elapsed time since the last export
  # event in the flow aggregator is equal to the value of this timeout.
  # Valid time units are "ns", "us" (or "µs"), "ms", "s", "m", "h".
  #activeFlowRecordTimeout: 60s

  # Provide the inactive flow record timeout as a duration string. This determines
  # how often the flow aggregator exports the inactive flow records to the flow
  # collector. A flow record is considered to be inactive if no matching record
  # has been received by the flow aggregator in the specified interval.
  # Valid time units are "ns", "us" (or "µs"), "ms", "s", "m", "h".
  #inactiveFlowRecordTimeout: 90s

  # Provide the transport protocol for the flow aggregator collecting process, which is tls, tcp or udp.
  #aggregatorTransportProtocol: "tls"

  # Provide DNS name or IP address of flow aggregator for generating TLS certificate. It must match
  # the flowCollectorAddr parameter in the antrea-agent config.
  #flowAggregatorAddress: "flow-aggregator.flow-aggregator.svc"

  # recordContents enables configuring some fields in the flow records. Fields can
  # be excluded to reduce record size, but some features or external tooling may
  # depend on these fields.
  recordContents:
    # Determine whether source and destination Pod labels will be included in the flow records.
    #podLabels: false

  # apiServer contains APIServer related configuration options.
  apiServer:
    # The port for the flow-aggregator APIServer to serve on.
    #apiPort: 10348

    # Comma-separated list of Cipher Suites. If omitted, the default Go Cipher Suites will be used.
    # https://golang.org/pkg/crypto/tls/#pkg-constants
    # Note that TLS1.3 Cipher Suites cannot be added to the list. But the apiserver will always
    # prefer TLS1.3 Cipher Suites whenever possible.
    #tlsCipherSuites:

    # TLS min version from: VersionTLS10, VersionTLS11, VersionTLS12, VersionTLS13.
    #tlsMinVersion:

  # flowCollector contains external IPFIX or JSON collector related configuration options.
  flowCollector:
    # Enable is the switch to enable exporting flow records to external flow collector.
    #enable: false

    # Provide the flow collector address as string with format <IP>:<port>[:<proto>], where proto is tcp or udp.
    # If no L4 transport proto is given, we consider tcp as default.
    address: "192.168.86.86:4739:tcp"

    # Provide the 32-bit Observation Domain ID which will uniquely identify this instance of the flow
    # aggregator to an external flow collector. If omitted, an Observation Domain ID will be generated
    # from the persistent cluster UUID generated by Antrea. Failing that (e.g. because the cluster UUID
    # is not available), a value will be randomly generated, which may vary across restarts of the flow
    # aggregator.
    #observationDomainID:

    # Provide format for records sent to the configured flow collector.
    # Supported formats are IPFIX and JSON.
    #recordFormat: "IPFIX"

  # clickHouse contains ClickHouse related configuration options.
  clickHouse:
    # Enable is the switch to enable exporting flow records to ClickHouse.
    #enable: false

    # Database is the name of database where Antrea "flows" table is created.
    #database: "default"

    # DatabaseURL is the url to the database. TCP protocol is required.
    #databaseURL: "tcp://clickhouse-clickhouse.flow-visibility.svc:9000"

    # Debug enables debug logs from ClickHouse sql driver.
    #debug: false

    # Compress enables lz4 compression when committing flow records.
    #compress: true

    # CommitInterval is the periodical interval between batch commit of flow records to DB.
    # Valid time units are "ns", "us" (or "µs"), "ms", "s", "m", "h".
    # The minimum interval is 1s based on ClickHouse documentation for best performance.
    #commitInterval: "8s"
Please note that the default values for activeFlowRecordTimeout,
inactiveFlowRecordTimeout, aggregatorTransportProtocol, and
flowAggregatorAddress parameters are set to 60s, 90s, tls and
flow-aggregator.flow-aggregator.svc, respectively. Please make sure that
aggregatorTransportProtocol and protocol of flowCollectorAddr in
agent-agent.conf are set to tls to guarantee secure communication works
properly. Protocol of flowCollectorAddr and aggregatorTransportProtocol
must always match, so TLS must either be enabled for both sides or disabled
for both sides. Please modify the parameters as per your requirements.
Please note that the default value for recordContents.podLabels is false,
which indicates source and destination Pod labels will not be included in the
flow records exported to flowCollector and clickHouse. If you would like
to include them, you can modify the value to true.
Please note that the default value for apiServer.apiPort is 10348, which
is the port used to expose the Flow Aggregator’s APIServer. Please modify the
parameters as per your requirements.
Please note that the default value for clickHouse.commitInterval is 8s,
which is based on experiment results to achieve best ClickHouse write
performance and data retention. Based on ClickHouse recommendation for best
performance, this interval is required be no shorter than 1s. Also note
that flow aggregator has a cache limit of ~500k records for ClickHouse-Grafana
collector. If clickHouse.commitInterval is set to a value too large, there’s
a risk of losing records.
IPFIX Information Elements (IEs) in an Aggregated Flow Record
In addition to IPFIX information elements provided in the above section, the Flow Aggregator adds the following fields to the flow records.
IEs from Antrea IE Registry
| IPFIX Information Element | Field ID | Type | Description |
|---|---|---|---|
| packetTotalCountFromSourceNode | 120 | unsigned64 | The cumulative number of packets for this flow as reported by the source Node, since the flow started. |
| octetTotalCountFromSourceNode | 121 | unsigned64 | The cumulative number of octets for this flow as reported by the source Node, since the flow started. |
| packetDeltaCountFromSourceNode | 122 | unsigned64 | The number of packets for this flow as reported by the source Node, since the previous report for this flow at the observation point. |
| octetDeltaCountFromSourceNode | 123 | unsigned64 | The number of octets for this flow as reported by the source Node, since the previous report for this flow at the observation point. |
| reversePacketTotalCountFromSourceNode | 124 | unsigned64 | The cumulative number of reverse packets for this flow as reported by the source Node, since the flow started. |
| reverseOctetTotalCountFromSourceNode | 125 | unsigned64 | The cumulative number of reverse octets for this flow as reported by the source Node, since the flow started. |
| reversePacketDeltaCountFromSourceNode | 126 | unsigned64 | The number of reverse packets for this flow as reported by the source Node, since the previous report for this flow at the observation point. |
| reverseOctetDeltaCountFromSourceNode | 127 | unsigned64 | The number of reverse octets for this flow as reported by the source Node, since the previous report for this flow at the observation point. |
| packetTotalCountFromDestinationNode | 128 | unsigned64 | The cumulative number of packets for this flow as reported by the destination Node, since the flow started. |
| octetTotalCountFromDestinationNode | 129 | unsigned64 | The cumulative number of octets for this flow as reported by the destination Node, since the flow started. |
| packetDeltaCountFromDestinationNode | 130 | unsigned64 | The number of packets for this flow as reported by the destination Node, since the previous report for this flow at the observation point. |
| octetDeltaCountFromDestinationNode | 131 | unsigned64 | The number of octets for this flow as reported by the destination Node, since the previous report for this flow at the observation point. |
| reversePacketTotalCountFromDestinationNode | 132 | unsigned64 | The cumulative number of reverse packets for this flow as reported by the destination Node, since the flow started. |
| reverseOctetTotalCountFromDestinationNode | 133 | unsigned64 | The cumulative number of reverse octets for this flow as reported by the destination Node, since the flow started. |
| reversePacketDeltaCountFromDestinationNode | 134 | unsigned64 | The number of reverse packets for this flow as reported by the destination Node, since the previous report for this flow at the observation point. |
| reverseOctetDeltaCountFromDestinationNode | 135 | unsigned64 | The number of reverse octets for this flow as reported by the destination Node, since the previous report for this flow at the observation point. |
| sourcePodLabels | 143 | string | |
| destinationPodLabels | 144 | string | |
| throughput | 145 | unsigned64 | The average amount of traffic flowing from source to destination, since the previous report for this flow at the observation point. The unit is bits per second. |
| reverseThroughput | 146 | unsigned64 | The average amount of reverse traffic flowing from destination to source, since the previous report for this flow at the observation point. The unit is bits per second. |
| throughputFromSourceNode | 147 | unsigned64 | The average amount of traffic flowing from source to destination, since the previous report for this flow at the observation point, based on the records sent from the source Node. The unit is bits per second. |
| throughputFromDestinationNode | 148 | unsigned64 | The average amount of traffic flowing from source to destination, since the previous report for this flow at the observation point, based on the records sent from the destination Node. The unit is bits per second. |
| reverseThroughputFromSourceNode | 149 | unsigned64 | The average amount of reverse traffic flowing from destination to source, since the previous report for this flow at the observation point, based on the records sent from the source Node. The unit is bits per second. |
| reverseThroughputFromDestinationNode | 150 | unsigned64 | The average amount of reverse traffic flowing from destination to source, since the previous report for this flow at the observation point, based on the records sent from the destination Node. The unit is bits per second. |
| flowEndSecondsFromSourceNode | 151 | unsigned32 | The absolute timestamp of the last packet of this flow, based on the records sent from the source Node. The unit is seconds. |
| flowEndSecondsFromDestinationNode | 152 | unsigned32 | The absolute timestamp of the last packet of this flow, based on the records sent from the destination Node. The unit is seconds. |
Supported Capabilities
Storage of Flow Records
Flow Aggregator stores the received flow records from Antrea Agents in a hash map, where the flow key is 5-tuple of a network connection. 5-tuple consists of Source IP, Destination IP, Source Port, Destination Port and Transport protocol. Therefore, Flow Aggregator maintains one flow record for any given connection, and this flow record gets updated till the connection in the Kubernetes cluster becomes invalid.
Correlation of Flow Records
In the case of inter-Node flows, there are two flow records, one from the source Node, where the flow originates from, and another one from the destination Node, where the destination Pod resides. Both the flow records contain incomplete information as mentioned here. Flow Aggregator provides support for the correlation of the flow records from the source Node and the destination Node, and it exports a single flow record with complete information for both inter-Node and intra-Node flows.
Aggregation of Flow Records
Flow Aggregator aggregates the flow records that belong to a single connection. As part of aggregation, fields such as flow timestamps, flow statistics etc. are updated. For the purpose of updating flow statistics fields, Flow Aggregator introduces the new fields in Antrea Enterprise IPFIX registry corresponding to the Source Node and Destination Node, so that flow statistics from different Nodes can be preserved.
Antctl Support
antctl can access the Flow Aggregator API to dump flow records and print metrics about flow record processing. Refer to the antctl documentation for more information.
Quick Deployment
If you would like to quickly try Network Flow Visibility feature, you can deploy Antrea, the Flow Aggregator Service, the Grafana Flow Collector on the Vagrant setup.
Image-building Steps
Build required image under antrea by using make command:
make
make flow-aggregator-image
If you would like to use Grafana flow collector, run:
make flow-visibility-clickhouse-monitor
Deployment Steps
Given any external IPFIX flow collector, you can deploy Antrea and the Flow Aggregator Service on a default Vagrant setup by running the following commands:
./infra/vagrant/provision.sh
./infra/vagrant/push_antrea.sh --flow-collector <externalFlowCollectorAddress>
If you would like to deploy the Grafana Flow Collector, you can run the following command:
./infra/vagrant/provision.sh
./infra/vagrant/push_antrea.sh --flow-collector Grafana
Flow Collectors
Here we list two choices the external configured flow collector: go-ipfix collector and Grafana flow collector. For each collector, we introduce how to deploy it and how to output or visualize the collected flow records information.
Go-ipfix Collector
Deployment Steps
The go-ipfix collector can be built from go-ipfix library. It is used to collect, decode and log the IPFIX records.
- To deploy a released version of the go-ipfix collector, please choose one
deployment manifest from the list of releases (supported after v0.5.2).
For any given release
(e.g. v0.5.2), you can deploy the collector as follows:
kubectl apply -f https://github.com/vmware/go-ipfix/releases/download/<TAG>/ipfix-collector.yaml
- To deploy the latest version of the go-ipfix collector (built from the main branch), use the checked-in deployment manifest:
kubectl apply -f https://raw.githubusercontent.com/vmware/go-ipfix/main/build/yamls/ipfix-collector.yaml
Go-ipfix collector also supports customization on its parameters: port and protocol. Please follow the go-ipfix documentation to configure those parameters if needed.
Output Flow Records
To output the flow records collected by the go-ipfix collector, use the command below:
kubectl logs <ipfix-collector-pod-name> -n ipfix
Grafana Flow Collector
The Grafana Flow Collector was added in Antrea v1.6.0. In Antrea v1.7.0, we start to move the network observability and analytics functionalities of Antrea to Project Theia, including the Grafana Flow Collector. Going forward, further development of the Grafana Flow Collector will be in the Theia repo, but we will keep the existing implementation in the Antrea repo for a while before deprecating it. This section talks about the “legacy” Grafana Flow Collector kept in the Antrea repo. For the up-to-date version of Grafana Flow Collector and other Theia features, please refer to the Theia document.
Purpose
Antrea supports sending IPFIX flow records through the Flow Exporter and Flow Aggregator feature described above. The Grafana Flow Collector works as the visualization tool for flow records and flow-related information. We use ClickHouse as the data storage, which collects flow records data from the Flow Aggregator and load the data to Grafana. This document provides the guidelines for deploying the Grafana Flow Collector with support for Antrea-specific IPFIX fields in a Kubernetes cluster.
About Grafana and ClickHouse
Grafana is an open-source platform for monitoring and observability. Grafana allows you to query, visualize, alert on and understand your metrics. ClickHouse is an open-source, high performance columnar OLAP database management system for real-time analytics using SQL. We use ClickHouse as the data storage, and use Grafana as the data visualization and monitoring tool.
Deployment Steps
To deploy the Grafana Flow Collector, the first step is to install the ClickHouse
Operator, which creates, configures and manages ClickHouse clusters. Check the
homepage
for more information about the ClickHouse Operator. Current checked-in yaml is based on their
v0.18.2 released version. Running the following command
will install ClickHouse Operator into kube-system Namespace.
kubectl apply -f https://raw.githubusercontent.com/antrea-io/antrea/main/build/yamls/clickhouse-operator-install-bundle.yml
To deploy a released version of the Grafana Flow Collector, find a deployment manifest
from the
list of releases.
For any given release
kubectl apply -f https://github.com/antrea-io/antrea/releases/download/<TAG>/flow-visibility.yml
To deploy the latest version of the Grafana Flow Collector (built from the main branch), use the checked-in deployment yaml:
kubectl apply -f https://raw.githubusercontent.com/antrea-io/antrea/main/build/yamls/flow-visibility.yml
Grafana is exposed through a NodePort Service by default in flow-visibility.yml.
If the given K8s cluster supports LoadBalancer Services, Grafana can be exposed
through a LoadBalancer Service by changing the grafana Service type in the manifest
like below.
apiVersion: v1
kind: Service
metadata:
  name: grafana
  namespace: flow-visibility
spec:
  ports:
  - port: 3000
    protocol: TCP
    targetPort: http-grafana
  selector:
    app: grafana
  sessionAffinity: None
  type: LoadBalancer
Please refer to the Flow Aggregator Configuration to learn about the ClickHouse configuration options.
Run the following command to check if ClickHouse and Grafana are deployed properly:
kubectl get all -n flow-visibility
The expected results will be like:
NAME                                  READY   STATUS    RESTARTS   AGE
pod/chi-clickhouse-clickhouse-0-0-0   2/2     Running   0          1m
pod/grafana-5c6c5b74f7-x4v5b          1/1     Running   0          1m

NAME                                    TYPE           CLUSTER-IP       EXTERNAL-IP   PORT(S)                         AGE
service/chi-clickhouse-clickhouse-0-0   ClusterIP      None             <none>        8123/TCP,9000/TCP,9009/TCP      1m
service/clickhouse-clickhouse           ClusterIP      10.102.124.56    <none>        8123/TCP,9000/TCP               1m
service/grafana                         NodePort       10.97.171.150    <none>        3000:31171/TCP                  1m

NAME                      READY   UP-TO-DATE   AVAILABLE   AGE
deployment.apps/grafana   1/1     1            1           1m

NAME                                 DESIRED   CURRENT   READY   AGE
replicaset.apps/grafana-5c6c5b74f7   1         1         1       1m

NAME                                             READY   AGE
statefulset.apps/chi-clickhouse-clickhouse-0-0   1/1     1m
Run the following commands to print the IP of the workder Node and the NodePort that Grafana is listening on:
NODE_NAME=$(kubectl get pod -l app=grafana -n flow-visibility -o jsonpath='{.items[0].spec.nodeName}')
NODE_IP=$(kubectl get nodes ${NODE_NAME} -o jsonpath='{.status.addresses[0].address}')
GRAFANA_NODEPORT=$(kubectl get svc grafana -n flow-visibility -o jsonpath='{.spec.ports[*].nodePort}')
echo "=== Grafana Service is listening on ${NODE_IP}:${GRAFANA_NODEPORT} ==="
You can now open the Grafana dashboard in the browser using http://[NodeIP]:[NodePort].
You should be able to see a Grafana login page. Login credentials:
- username: admin
- password: admin
To stop the Grafana Flow Collector, run the following commands:
kubectl delete -f flow-visibility.yml
kubectl delete -f https://raw.githubusercontent.com/antrea-io/antrea/main/build/yamls/clickhouse-operator-install-bundle.yml -n kube-system
Credentials Configuration
ClickHouse credentials are specified in flow-visibility.yml as a Secret named
clickhouse-secret.
apiVersion: v1
kind: Secret
metadata:
  name: clickhouse-secret
  namespace: flow-visibility
stringData:
  password: clickhouse_operator_password
  username: clickhouse_operator
type: Opaque
If the username clickhouse_operator has been changed, please
update the following section accordingly.
apiVersion: "clickhouse.altinity.com/v1"
kind: "ClickHouseInstallation"
metadata:
  name: clickhouse
  labels:
    app: clickhouse
spec:
  configuration:
    users:
      # replace clickhouse_operator by [new_username]
      clickhouse_operator/k8s_secret_password: flow-visibility/clickhouse-secret/password
      clickhouse_operator/networks/ip: "::/0"
ClickHouse credentials are also specified in flow-aggregator.yml as a Secret
named clickhouse-secret as shown below. Please also make the corresponding changes.
apiVersion: v1
kind: Secret
metadata:
  labels:
    app: flow-aggregator
  name: clickhouse-secret
  namespace: flow-aggregator
stringData:
  password: clickhouse_operator_password
  username: clickhouse_operator
type: Opaque
Grafana login credentials are specified in flow-visibility.yml as a Secret named
grafana-secret.
apiVersion: v1
kind: Secret
metadata:
  name: grafana-secret
  namespace: flow-visibility
stringData:
  admin-password: admin
  admin-username: admin
type: Opaque
We recommend changing all the credentials above if you are going to run the Flow Collector in production.
ClickHouse Configuration
Service Customization
The ClickHouse database can be accessed through the Service clickhouse-clickhouse.
The Pod exposes HTTP port at 8123 and TCP port at 9000 by default. The ports are
specified in flow-visibility.yml as serviceTemplates of a ClickHouseInstallation
resource. To use other ports, please update the following section.
serviceTemplates:
  - name: service-template
    spec:
      ports:
        - name: http
          port: 8123
        - name: tcp
          port: 9000
This Service is used by the Flow Aggregator and Grafana.
-
If you have changed the HTTP port, please update the
urlof a ConfigMap namedgrafana-datasource-providerinflow-visibility.yml. -
If you have changed the TCP port, please update the
databaseURLfollowing Flow Aggregator Configuration, and also update thejsonData.portof thegrafana-datasource-providerConfigMap.
apiVersion: v1
data:
  datasource_provider.yml: |
    apiVersion: 1
    datasources:
      - name: ClickHouse
        type: grafana-clickhouse-datasource
        access: proxy
        url: http://clickhouse-clickhouse.flow-visibility.svc:8123
        editable: true
        jsonData:
          server: clickhouse-clickhouse.flow-visibility.svc
          port: 9000
          username: $CLICKHOUSE_USERNAME
        secureJsonData:
          password: $CLICKHOUSE_PASSWORD
kind: ConfigMap
metadata:
  name: grafana-datasource-provider-h868k56k95
  namespace: flow-visibility
Performance Configuration
The ClickHouse throughput depends on two factors - the storage size of the ClickHouse and the time interval between the batch commits to the ClickHouse. Larger storage size and longer commit interval provide higher throughput.
Grafana flow collector supports the ClickHouse in-memory deployment with limited
storage size. This is specified in flow-visibility.yml under the clickhouse
resource of kind: ClickHouseInstallation. The default value of storage size for
the ClickHouse server is 8 GiB. Users can expect a linear growth in the ClickHouse
throughput when they enlarge the storage size. For development or testing environment,
you can decrease the storage size to 2GiB. To deploy the ClickHouse with a different
storage size, please modify the sizeLimit in the following section.
- emptyDir:
    medium: Memory
    sizeLimit: 8Gi
  name: clickhouse-storage-volume
To deploy ClickHouse with Persistent Volumes and limited storage size, please refer to Persistent Volumes.
The time interval between the batch commits to the ClickHouse is specified in the
Flow Aggregator Configuration as commitInterval. The
ClickHouse throughput grows sightly when the commit interval grows from 1s to 8s.
A commit interval larger than 8s provides little improvement on the throughput.
Persistent Volumes
By default, ClickHouse is deployed in memory. From Antrea v1.7, we support deploying ClickHouse with Persistent Volumes.
PersistentVolume
(PV) is a piece of storage in the K8s cluster, which requires to be manually
provisioned by an administrator or dynamically provisioned using Storage Classes.
A PersistentVolumeClaim (PVC) is a request for storage which consumes PV. As
ClickHouse is deployed as a StatefulSet, the volume can be claimed using
volumeClaimTemplate.
To generate the manifest automatically with default settings, you can clone the repository and run one of the following commands:
# To generate a manifest with Local PV for the ClickHouse
./hack/generate-manifest-flow-visibility.sh --volume pv --local <local_path> > flow-visibility.yml

# To generate a manifest with NFS PV for the ClickHouse
./hack/generate-manifest-flow-visibility.sh --volume pv --nfs <nfs_server_address>:/<nfs_server_path> > flow-visibility.yml

# To generate a manifest with a customized StorageClass for the ClickHouse
./hack/generate-manifest-flow-visibility.sh --volume pv --storageclass <storageclass_name> > flow-visibility.yml
If you prefer not to clone the repository and prefer to create a customized manifest manually, please follow the steps below to deploy the ClickHouse with Persistent Volumes:
-
Provision the PersistentVolume. K8s supports a great number of PersistentVolume types. You can provision your own PersistentVolume per your requirements. Here are two simple examples for your reference.
-
Local PV allows you to store the ClickHouse data at a pre-defined path on a specific Node. Refer to createLocalPv.yml to create the PV. Please replace
LOCAL_PATHwith the path to store the ClickHouse data and label the Node used to store the ClickHouse data withantrea.io/clickhouse-data-node=. -
NFS PV allows you to store the ClickHouse data on an existing NFS server. Refer to createNfsPv.yml to create the PV. Please replace
NFS_SERVER_ADDRESSwith the host name of the NFS server andNFS_SERVER_PATHwith the exported path on the NFS server.
In both examples, you can set
.spec.capacity.storagein PersistentVolume to your storage size. This value is for informative purpose as K8s does not enforce the capacity of PVs. If you want to limit the storage usage, you need to ask for your storage system to enforce that. For example, you can create a Local PV on a partition with the limited size. We recommend using a dedicated saving space for the ClickHouse if you are going to run the Flow Collector in production.As these examples do not use any dynamic provisioner, the reclaim policy for the PVs is
Retainby default. After stopping the Grafana Flow Collector, if you no long need the data for future use, you may need to manually clean up the data on the local disk or NFS server. -
-
Request the PV for ClickHouse. Please add a
volumeClaimTemplatesection under.spec.templatesfor the resourceClickHouseInstallationinflow-visibility.ymlas shown in the example below.storageClassNameshould be set to your ownStorageClassname, and.resources.requests.storageshould be set to your storage size.volumeClaimTemplates: - name: clickhouse-storage-template spec: accessModes: - ReadWriteOnce resources: requests: storage: 8Gi storageClassName: clickhouse-storageThen add this template as
dataVolumeClaimTemplateto the section below.defaults: templates: dataVolumeClaimTemplate: clickhouse-storage-template podTemplate: pod-template serviceTemplate: service-template -
Remove the in-memory related deployment options, by removing the appropriate
volumeandvolumeMountfor theClickHouseInstallationresource inflow-visibility.yml.The
volumeMountsentry to be removed is the following one:- mountPath: /var/lib/clickhouse name: clickhouse-storage-volumeThe
volumesentry to be removed is the following one:- emptyDir: medium: Memory sizeLimit: 8Gi name: clickhouse-storage-volume
Pre-built Dashboards
The following dashboards are pre-built and are recommended for Antrea flow
visualization. They can be found in the Home page of Grafana, by clicking
the Magnifier button on the left menu bar.

-
Note that all pre-built dashboards (except for the “Flow Records Dashboard”) filter out Pod traffic for which the source or destination Namespace is one of
kube-system,flow-visibility, orflow-aggregator. The primary motivation for this is to avoid showing the connections between the Antrea Agents and the Flow Aggregator, between the Flow Aggregator and ClickHouse, and between ClickHouse and Grafana. -
Also note that we limit the number of values displayed on panels. For table panel on the Flow Records Dashboard, the limit is set to 10000. For Sankey diagrams, the limit is 50. For time-series line graphs, the limit is 50. For pie charts, the limit is 25. The motivation is, when the input data is very large, we want to keep the charts readable and avoid consuming too much time and resources to render them.
If you want to stop filtering traffic by Namespace, or edit the panel limit,
you will need to edit the ClickHouse SQL query for each individual panel. Please
follow the
dashboards customization section for
more information. As a special case, to edit the panel limit for pie charts,
instead of editing the query, please follow the
doc
to edit Value options - Limit.
Flow Records Dashboard
Flow Records Dashboard displays the number of flow records being captured in the selected time range. The detailed metadata of each of the records can be found in the table below.
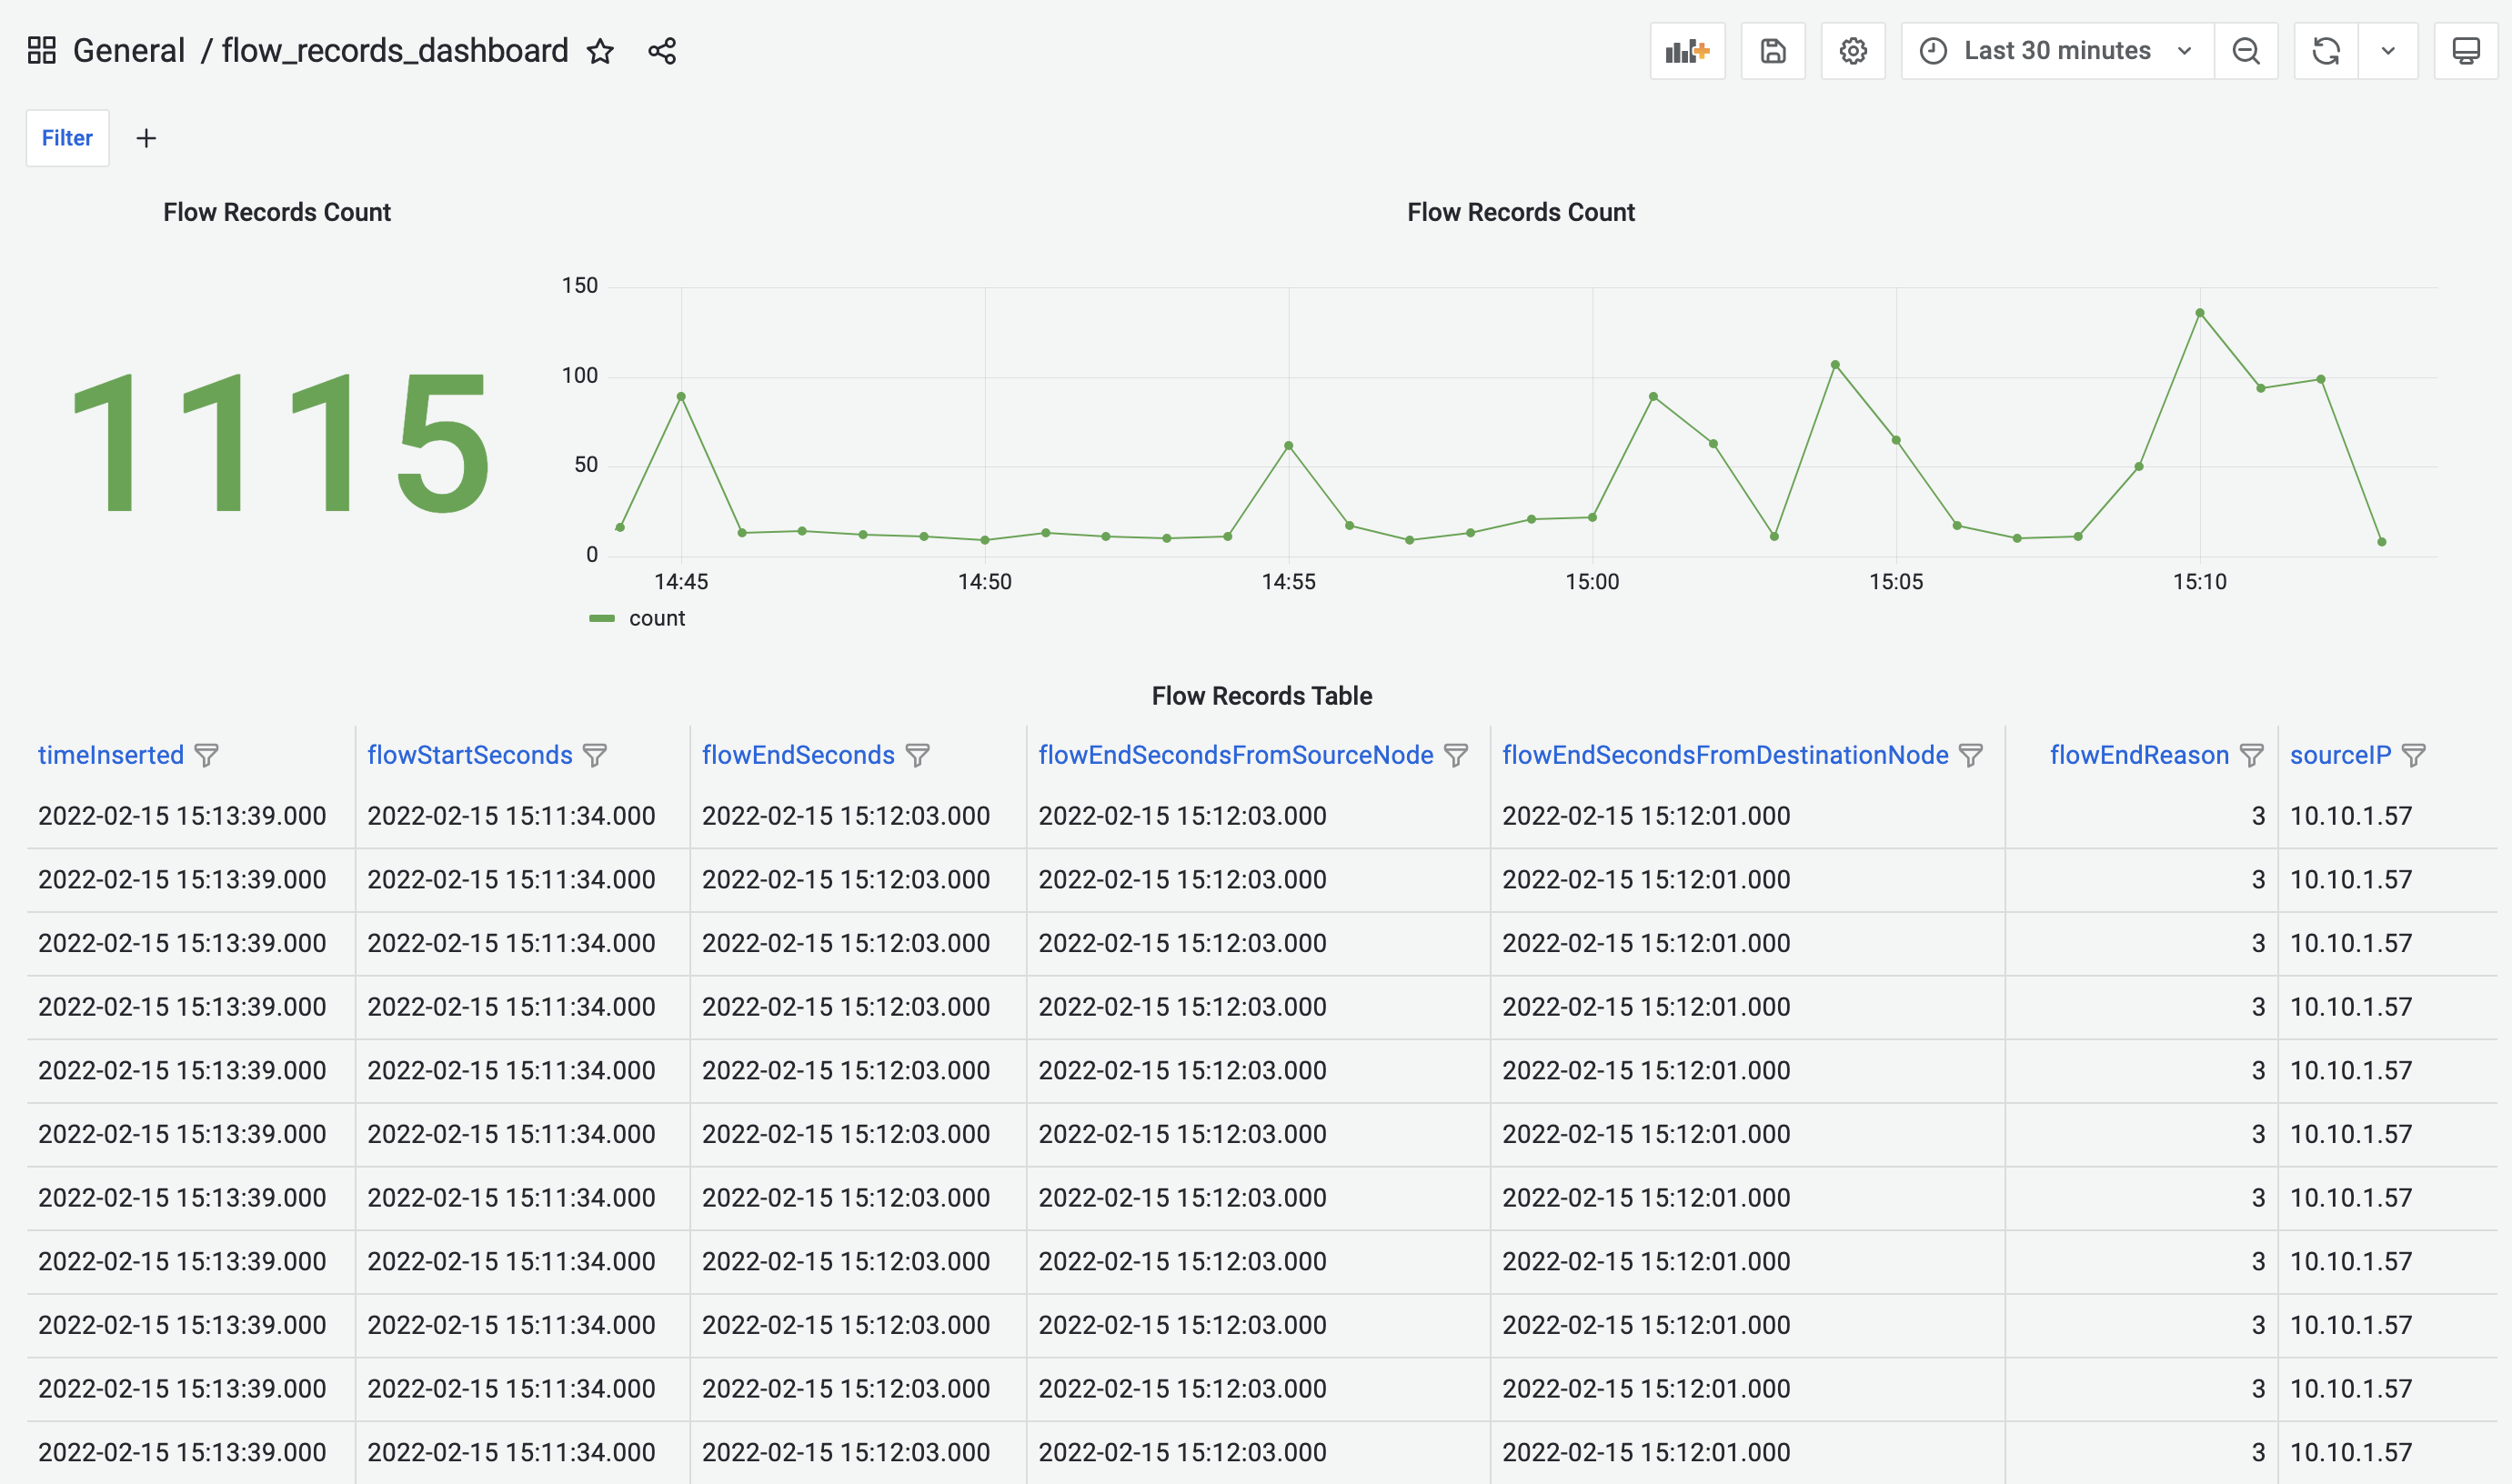
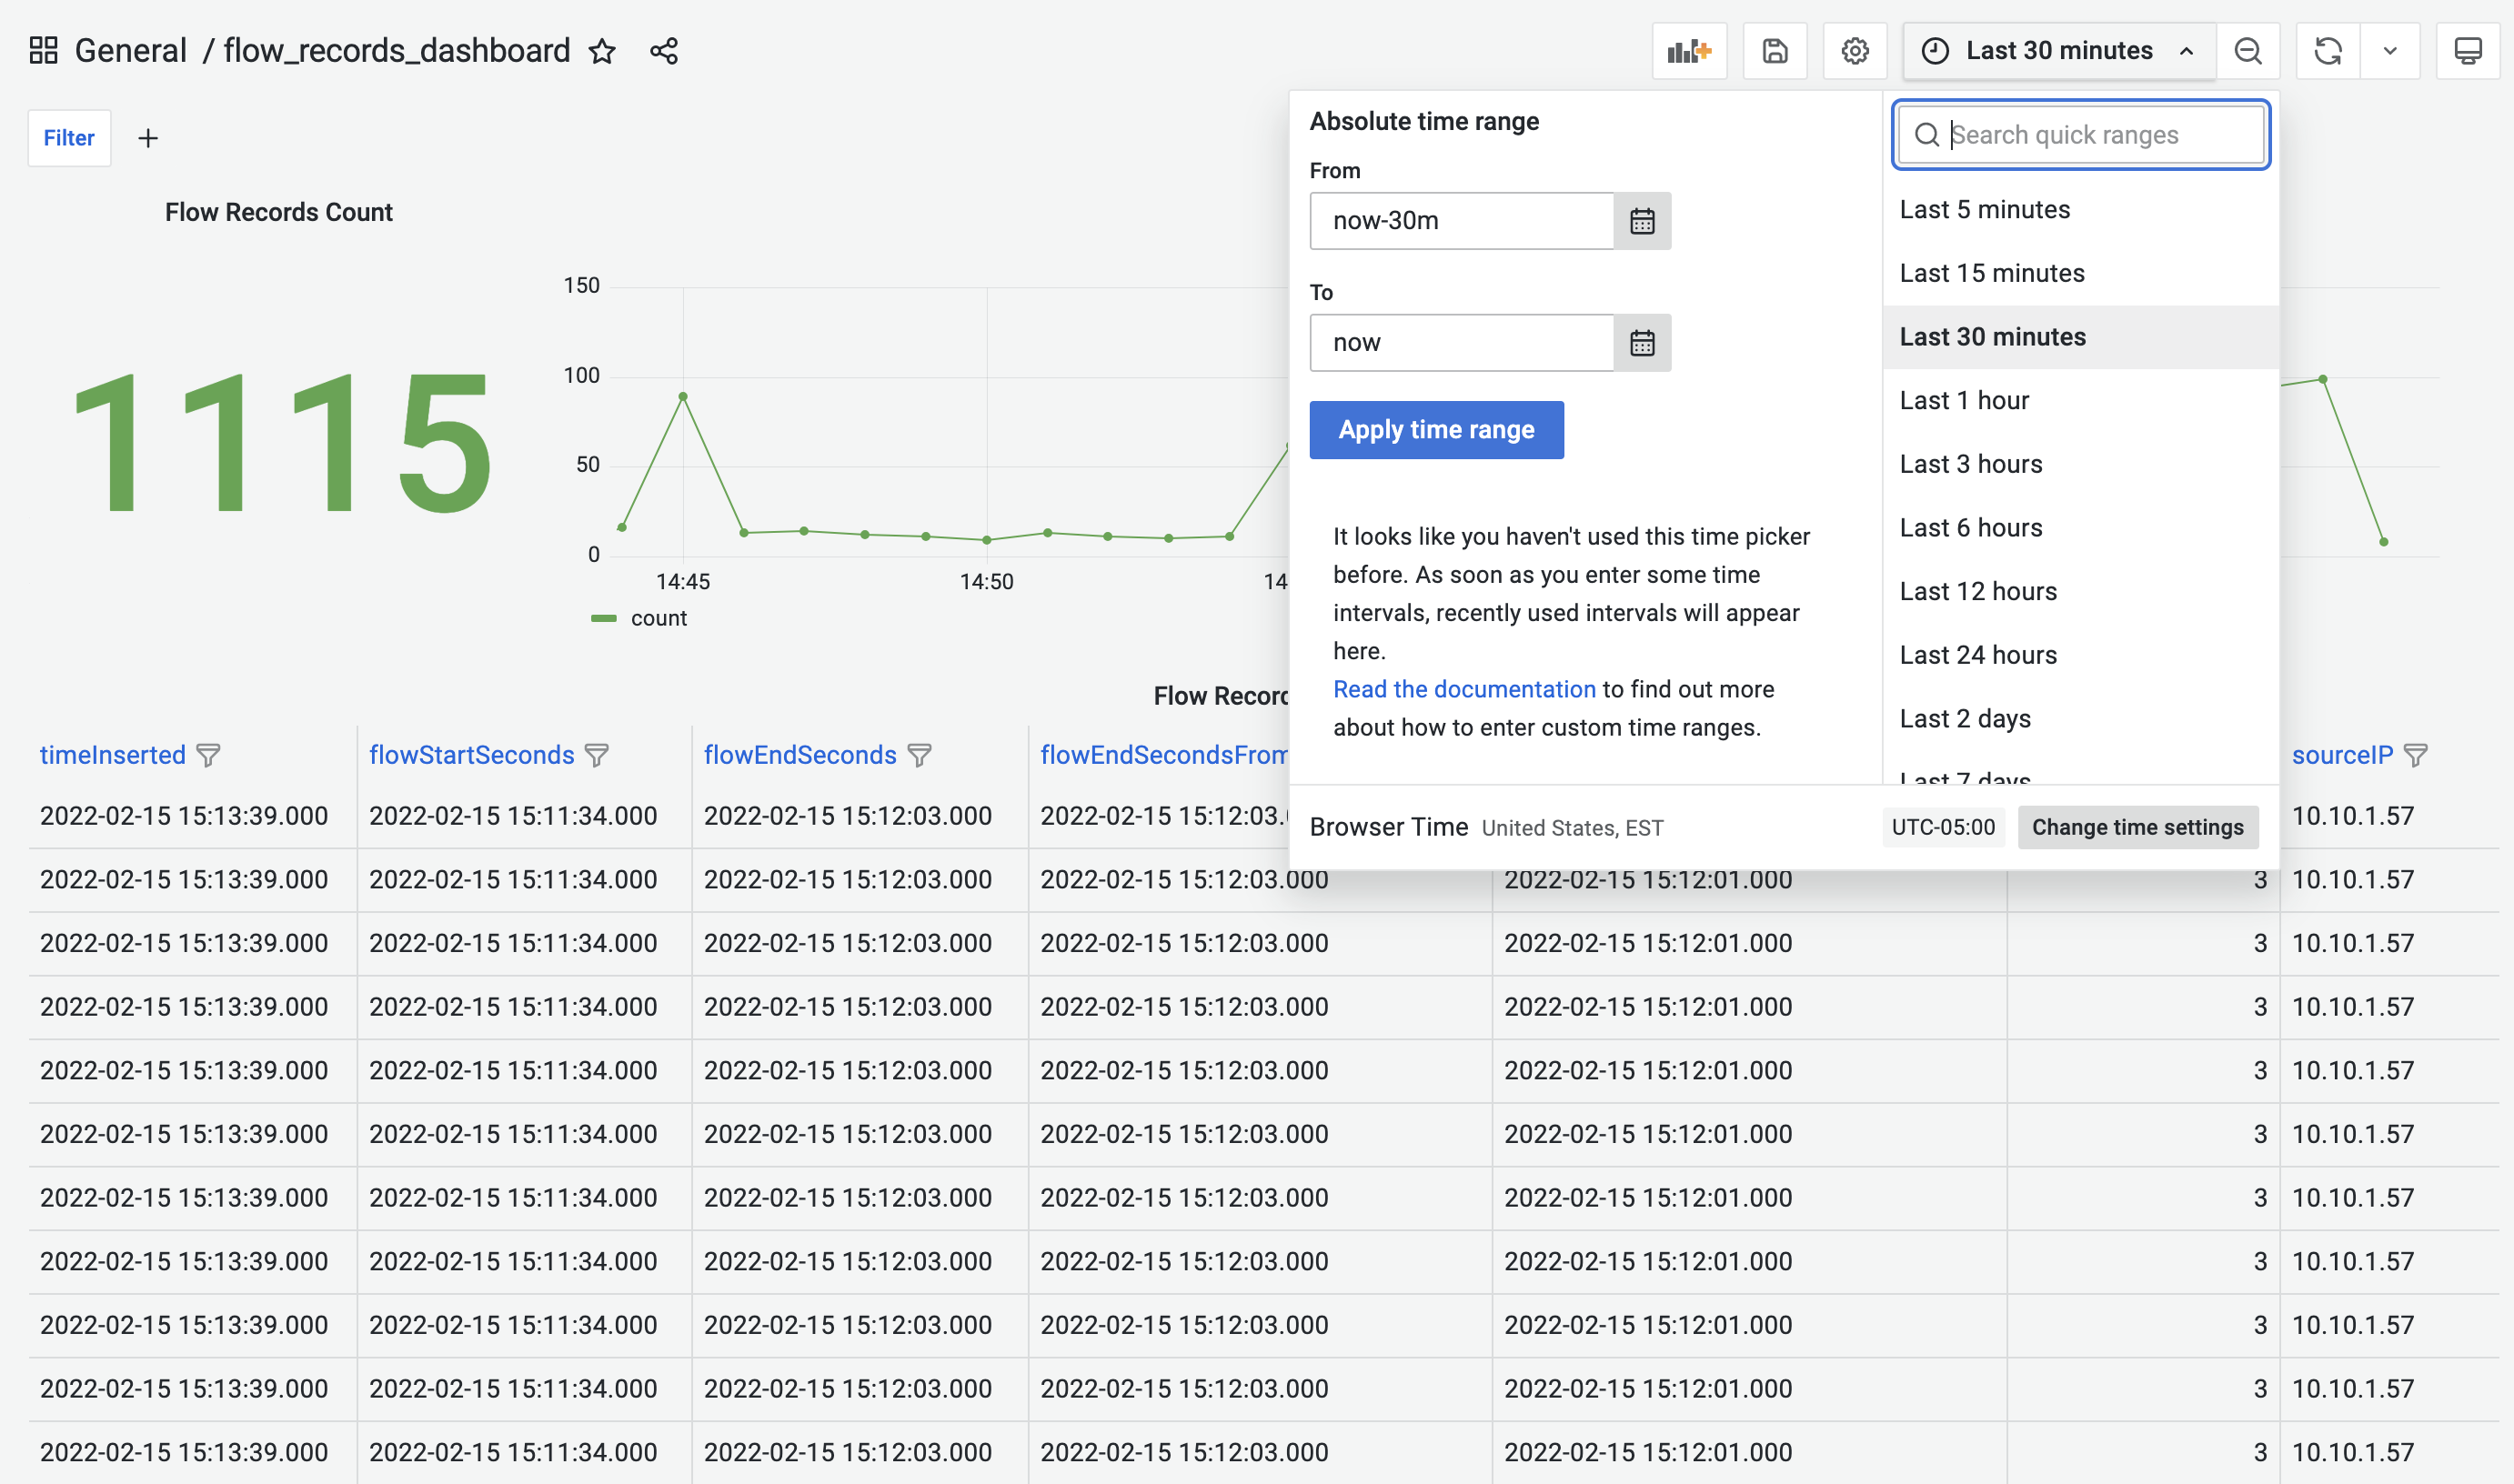
Flow Records Dashboard provides time-range control. The selected time-range will be applied to all the panels in the dashboard. This feature is also available for all the other pre-built dashboards.
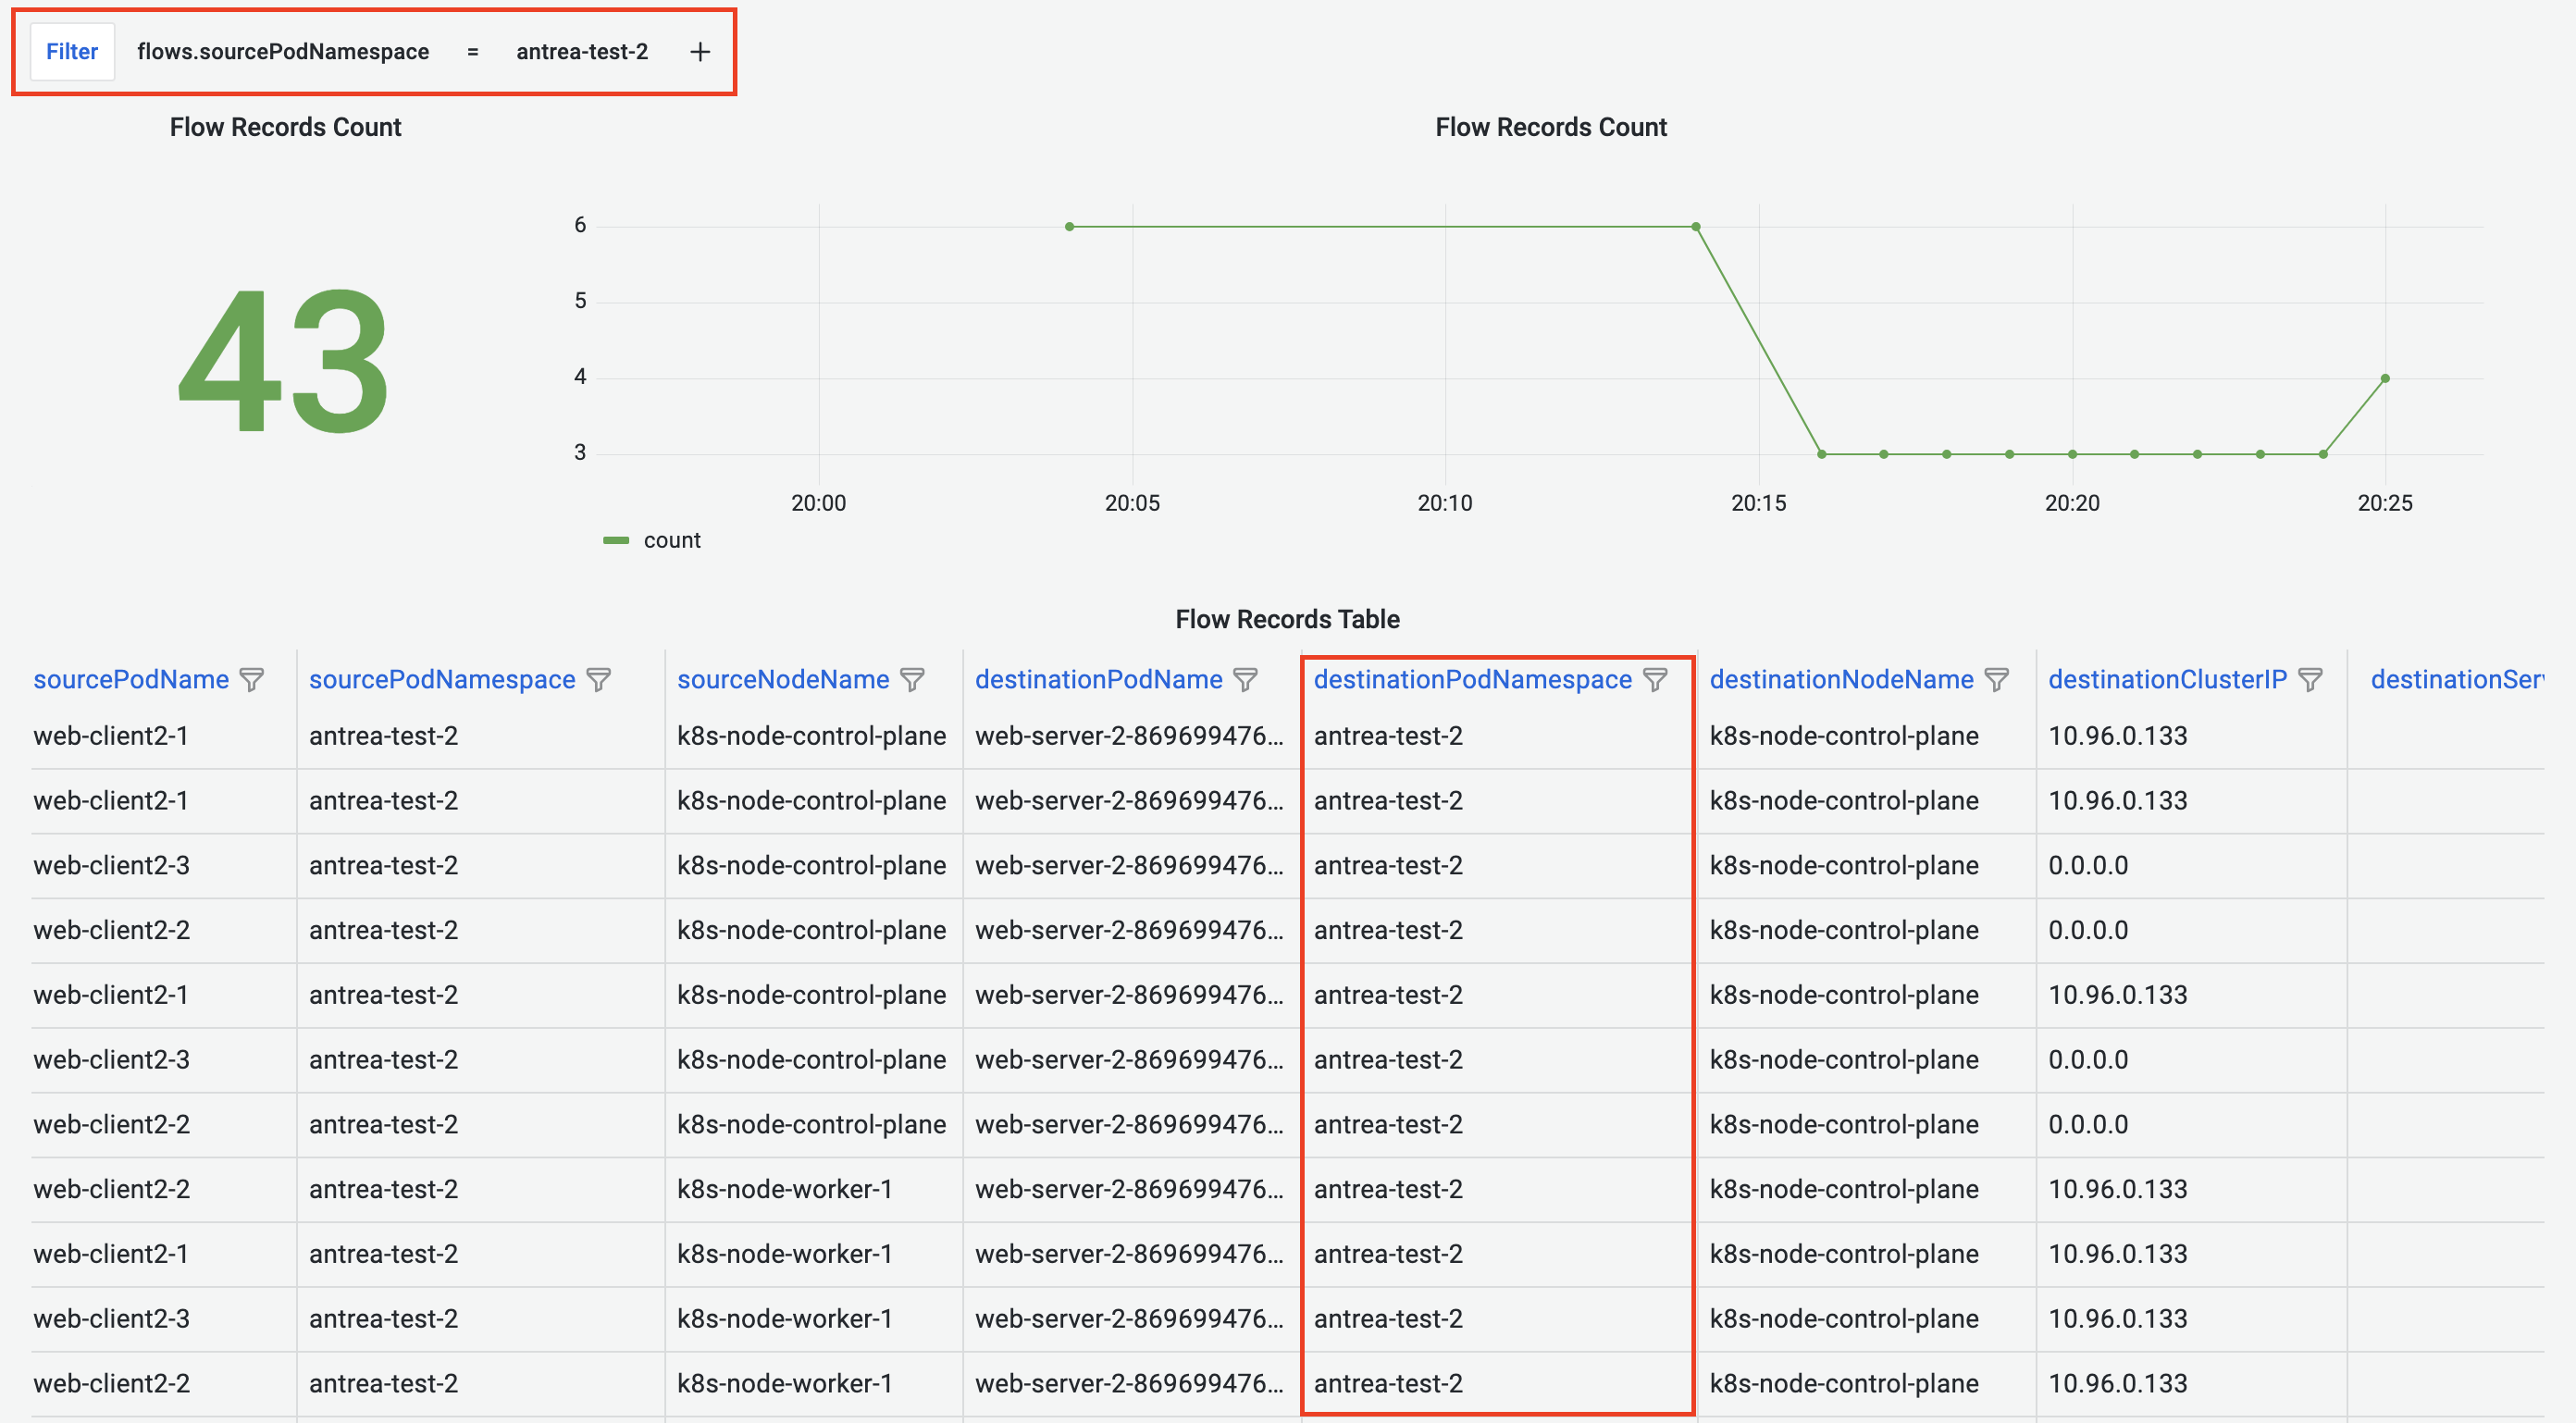
Flow Records Dashboard allows us to add key/value filters that automatically apply to all the panels in the dashboard. This feature is also available for all the other pre-built dashboards.
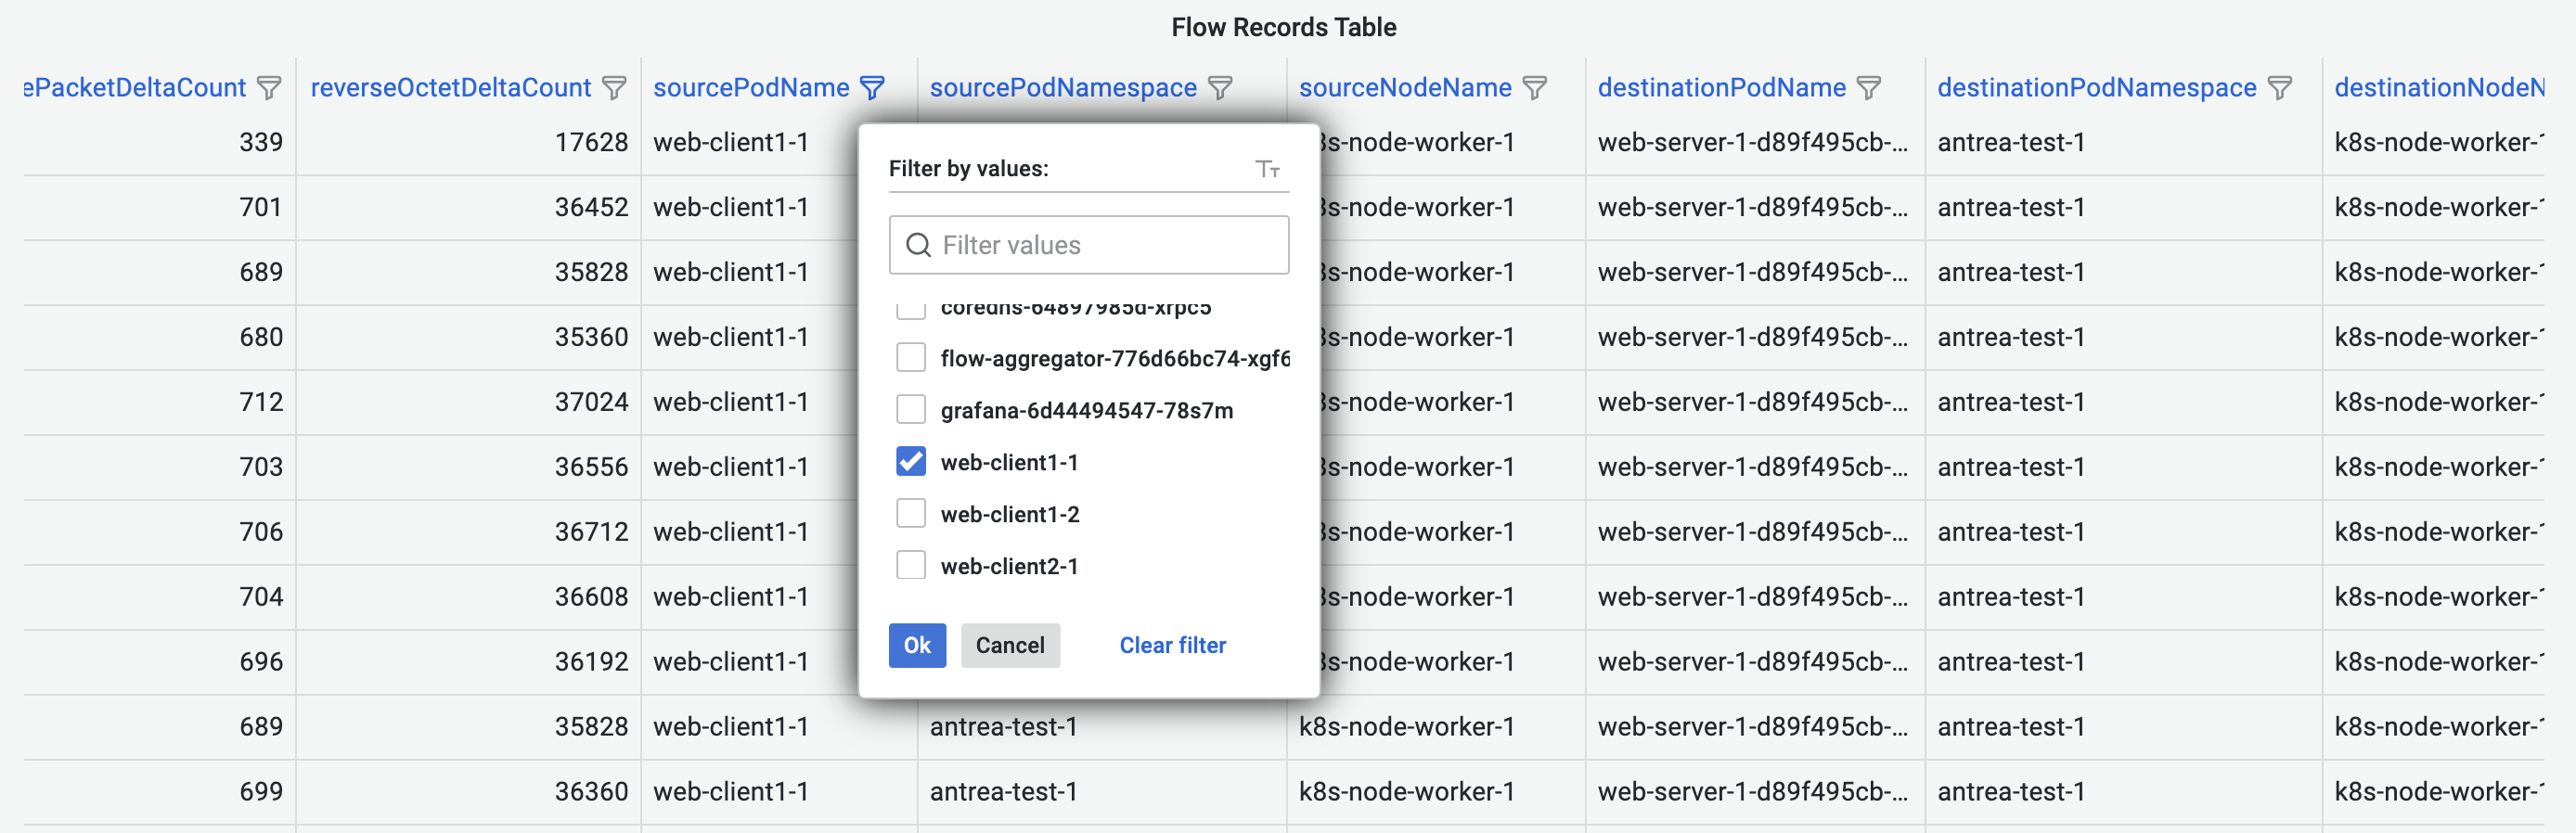
Besides the dashboard-wide filter, Flow Records Dashboard also provides column-based filters that apply to each table column.
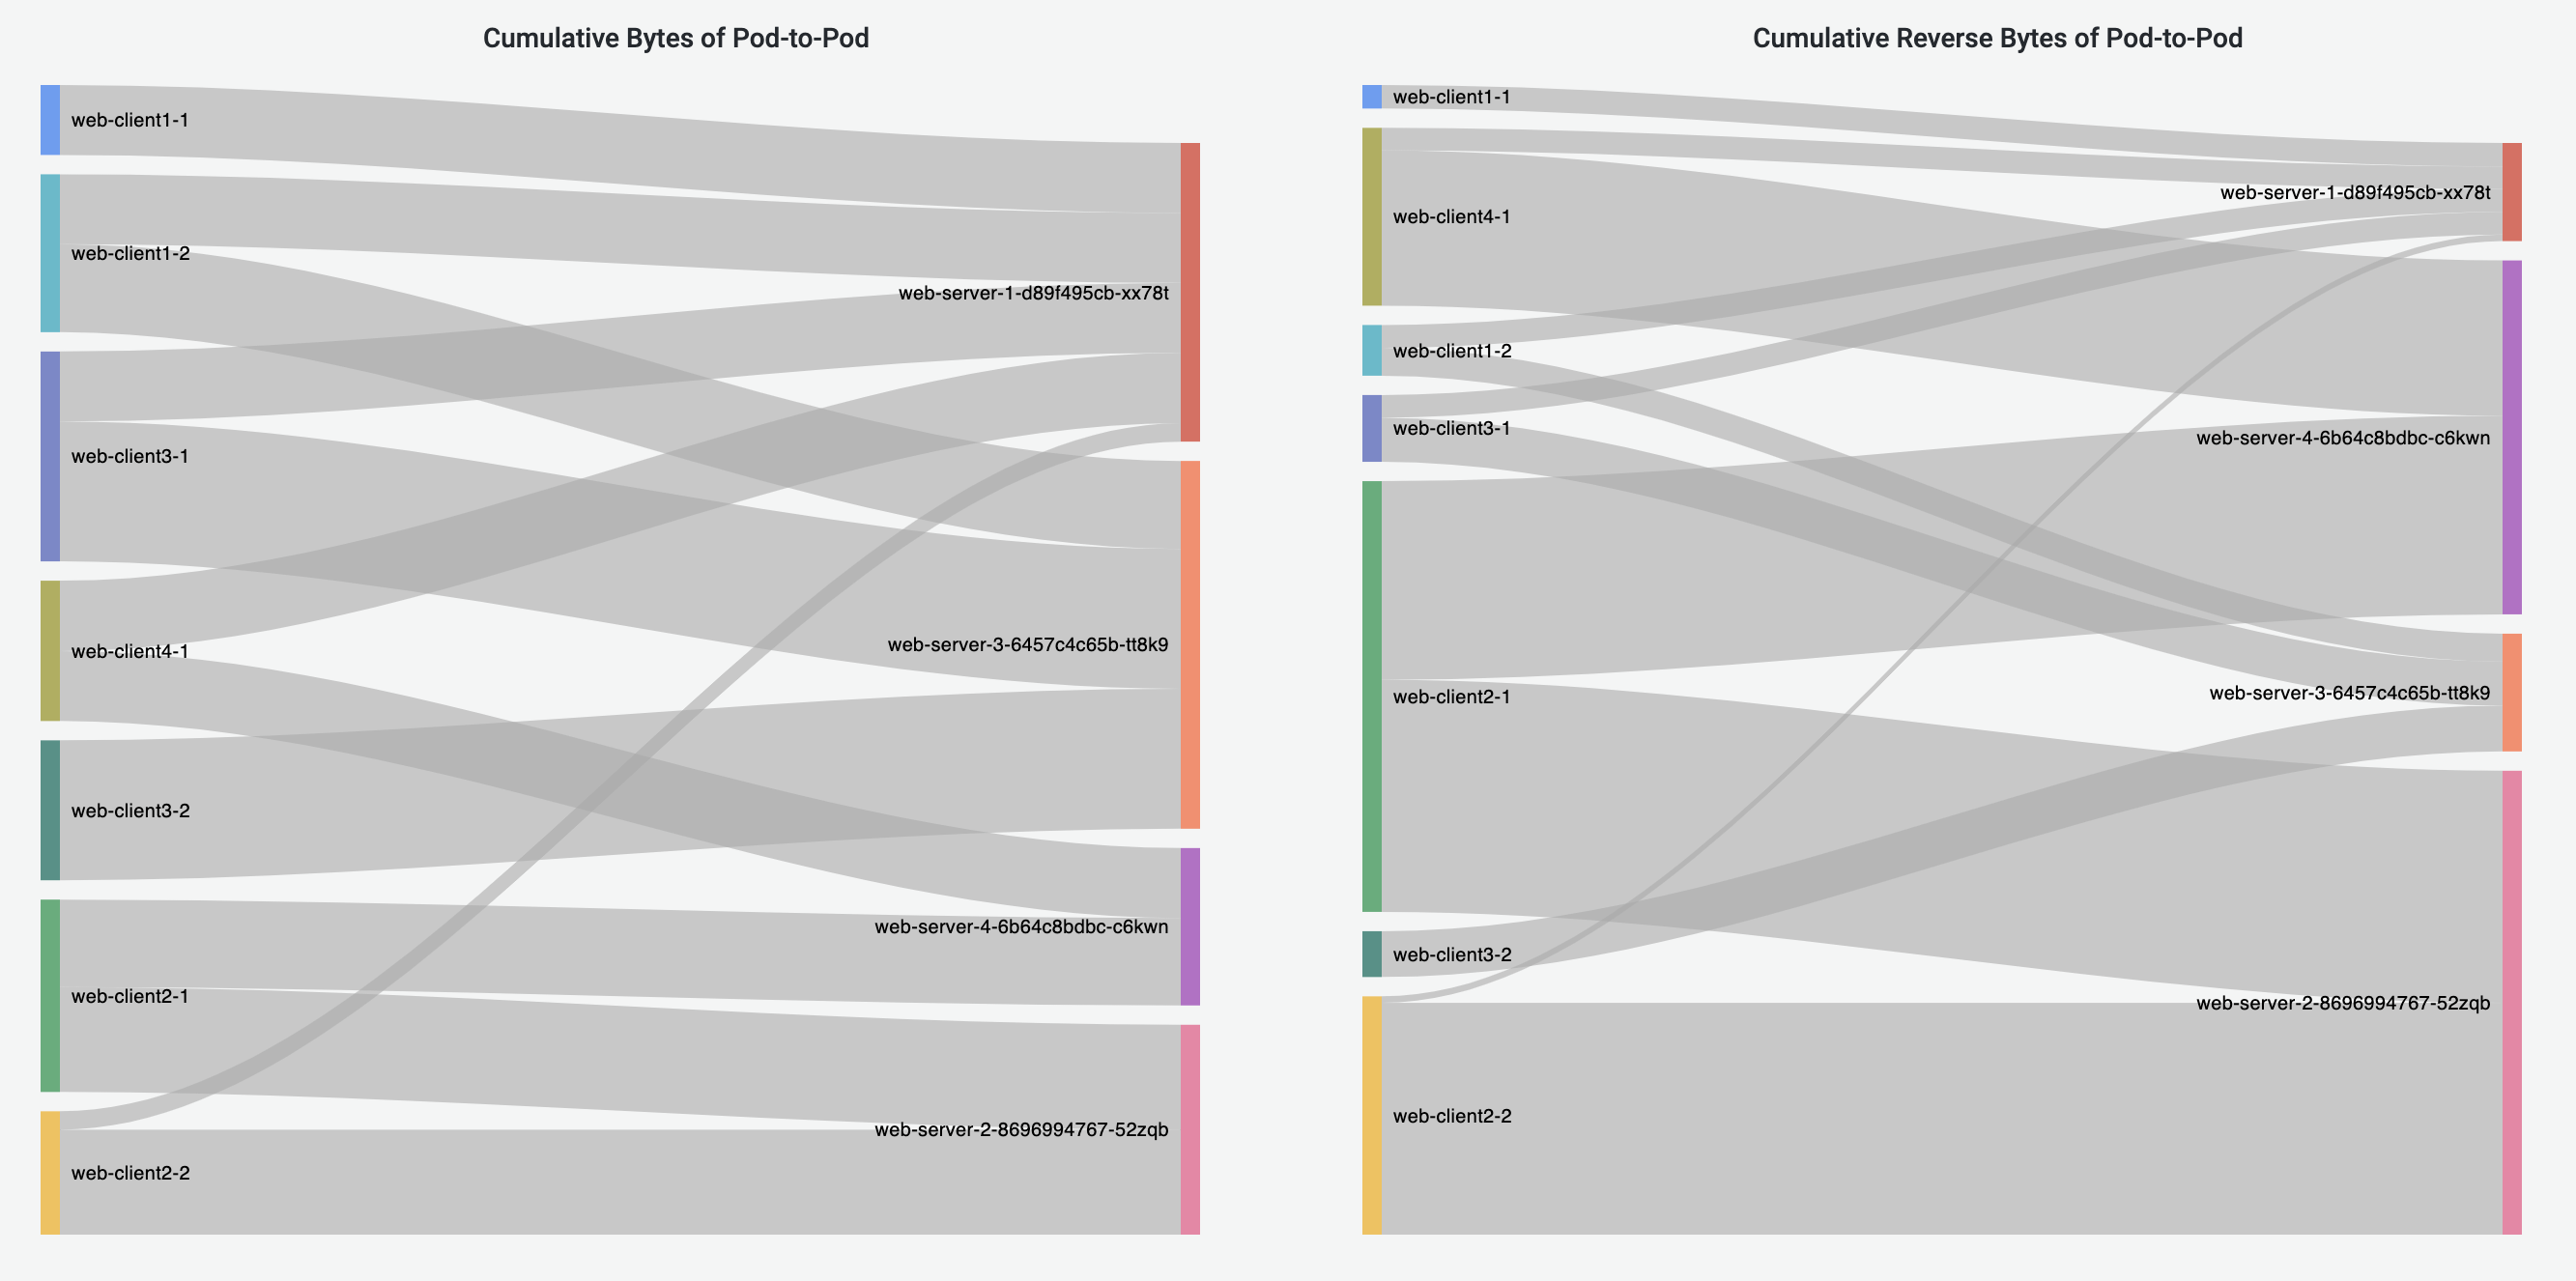
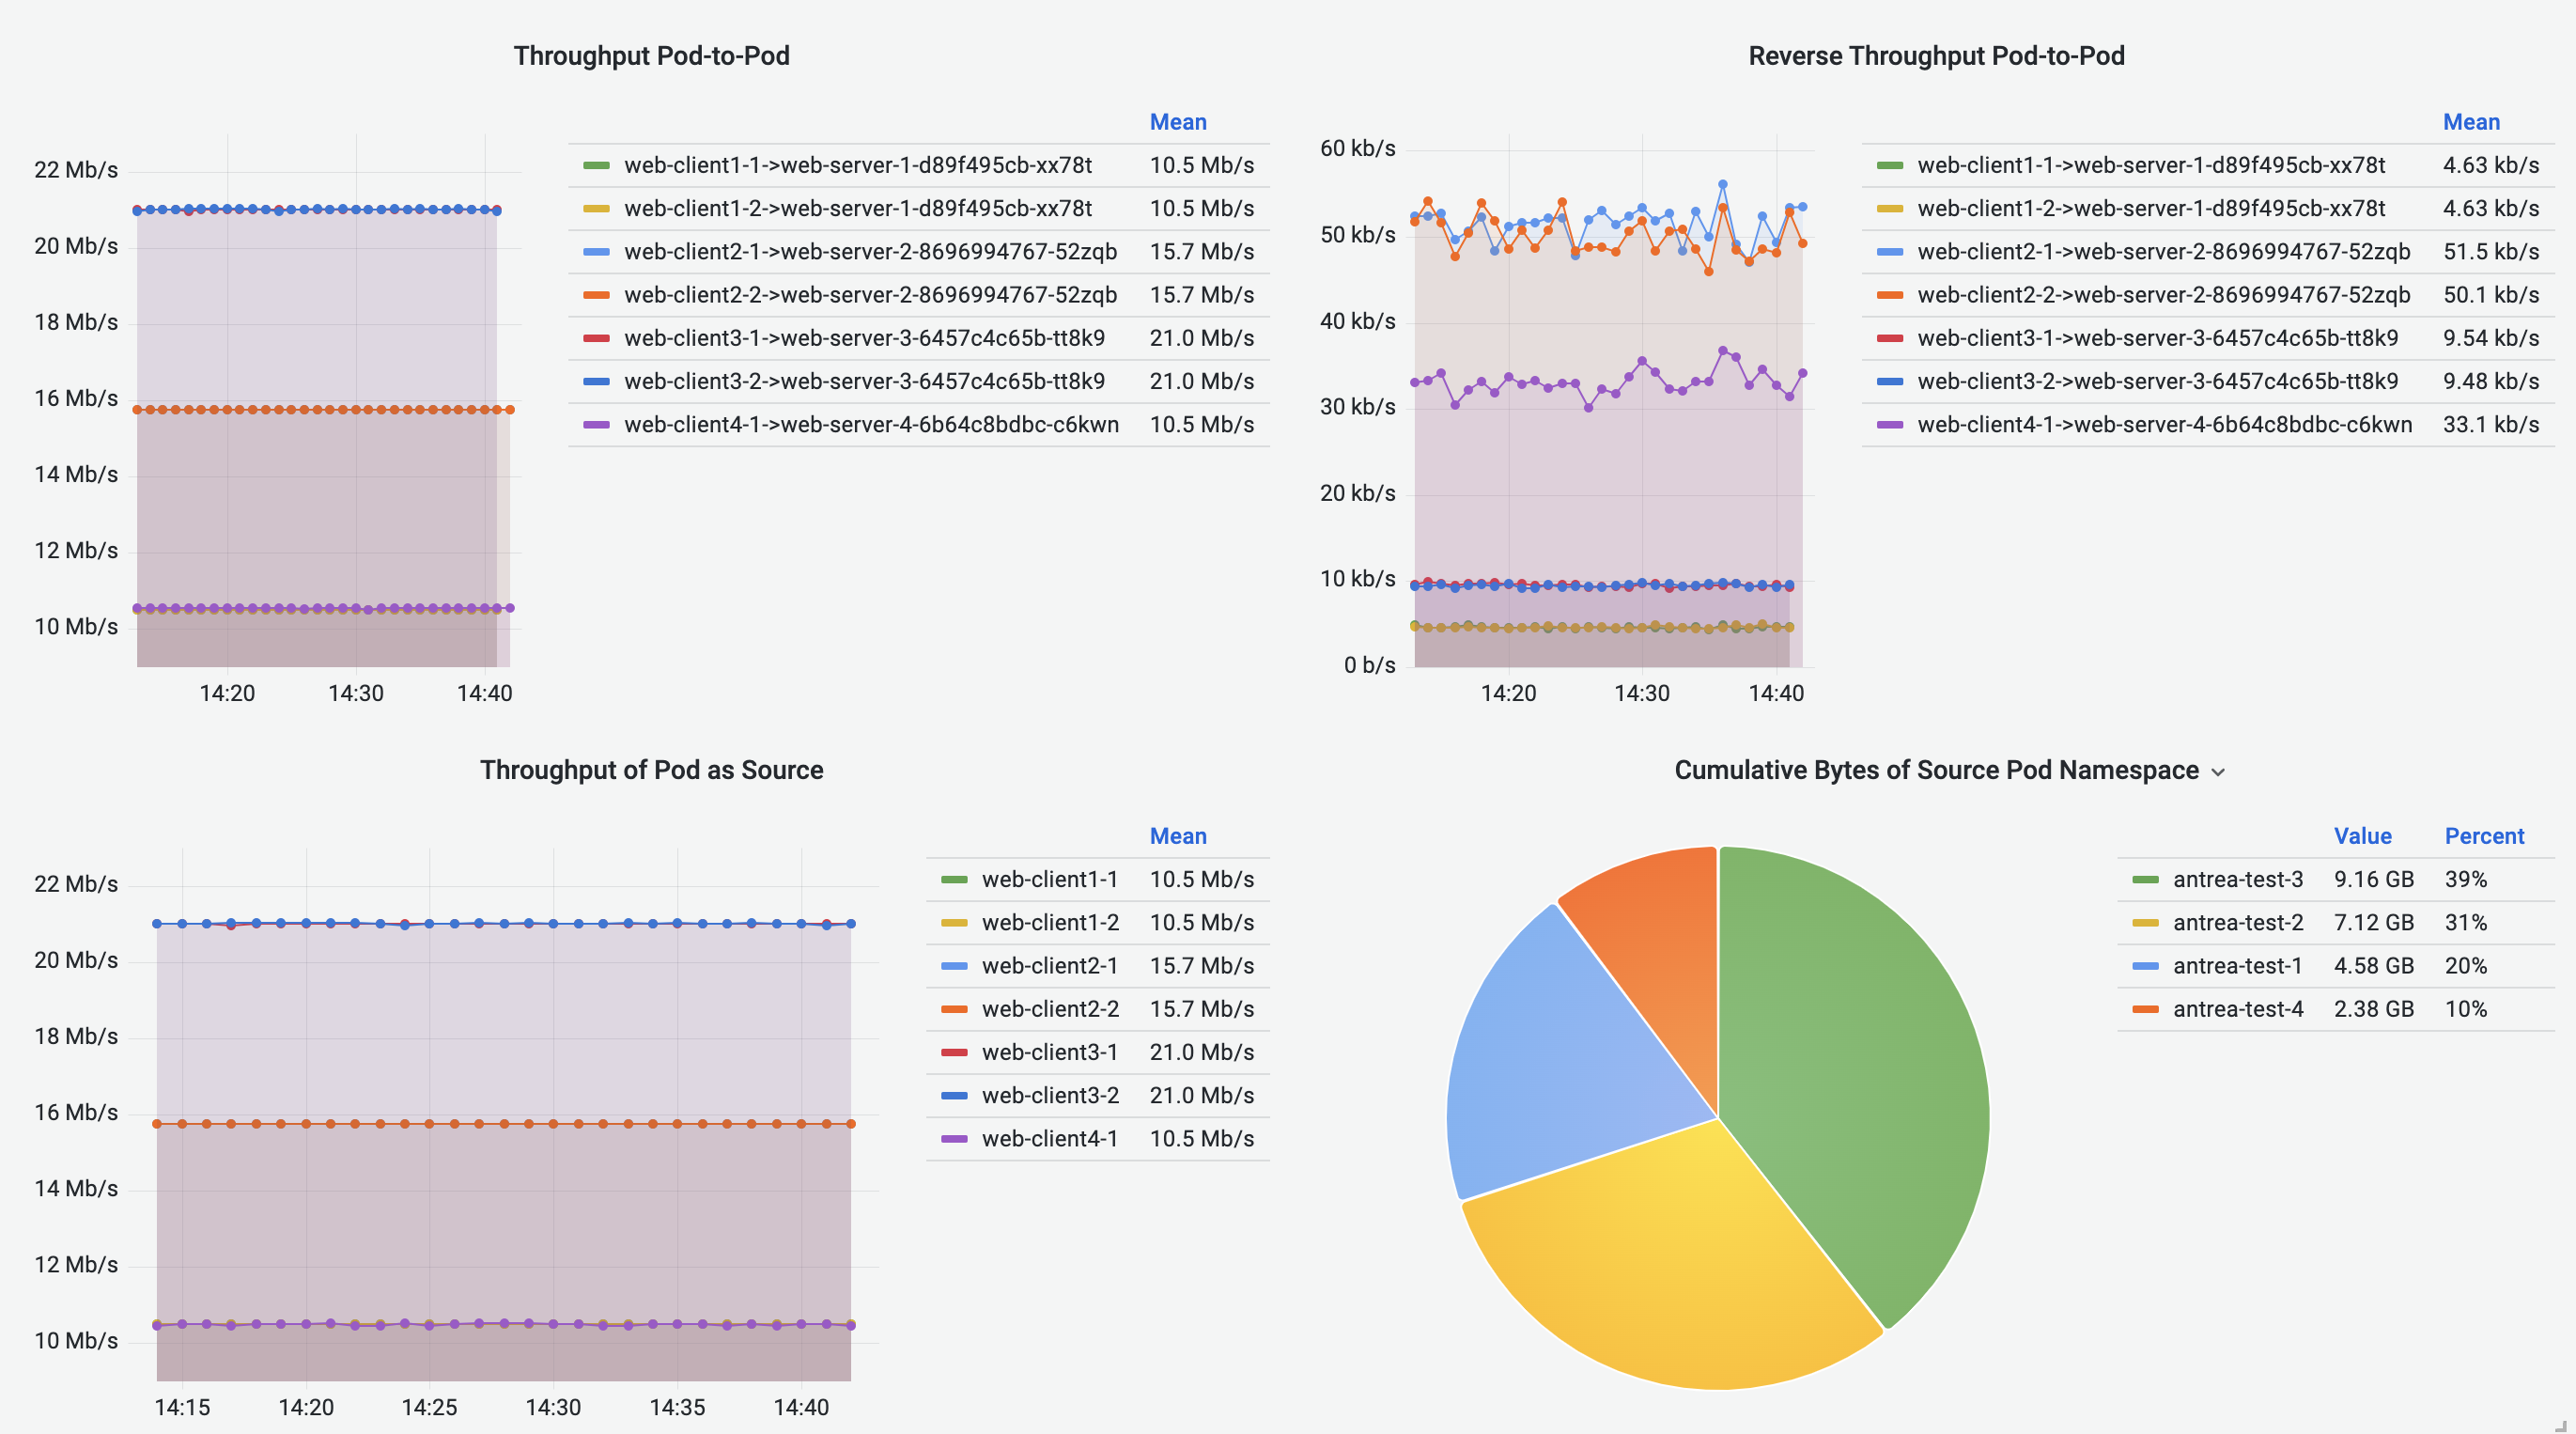
Pod-to-Pod Flows Dashboard
Pod-to-Pod Flows Dashboard shows cumulative bytes and reverse bytes of Pod-to-Pod traffic in the selected time range, in the form of Sankey diagram. Corresponding source or destination Pod throughput is visualized using the line graphs. Pie charts visualize the cumulative traffic grouped by source or destination Pod Namespace.
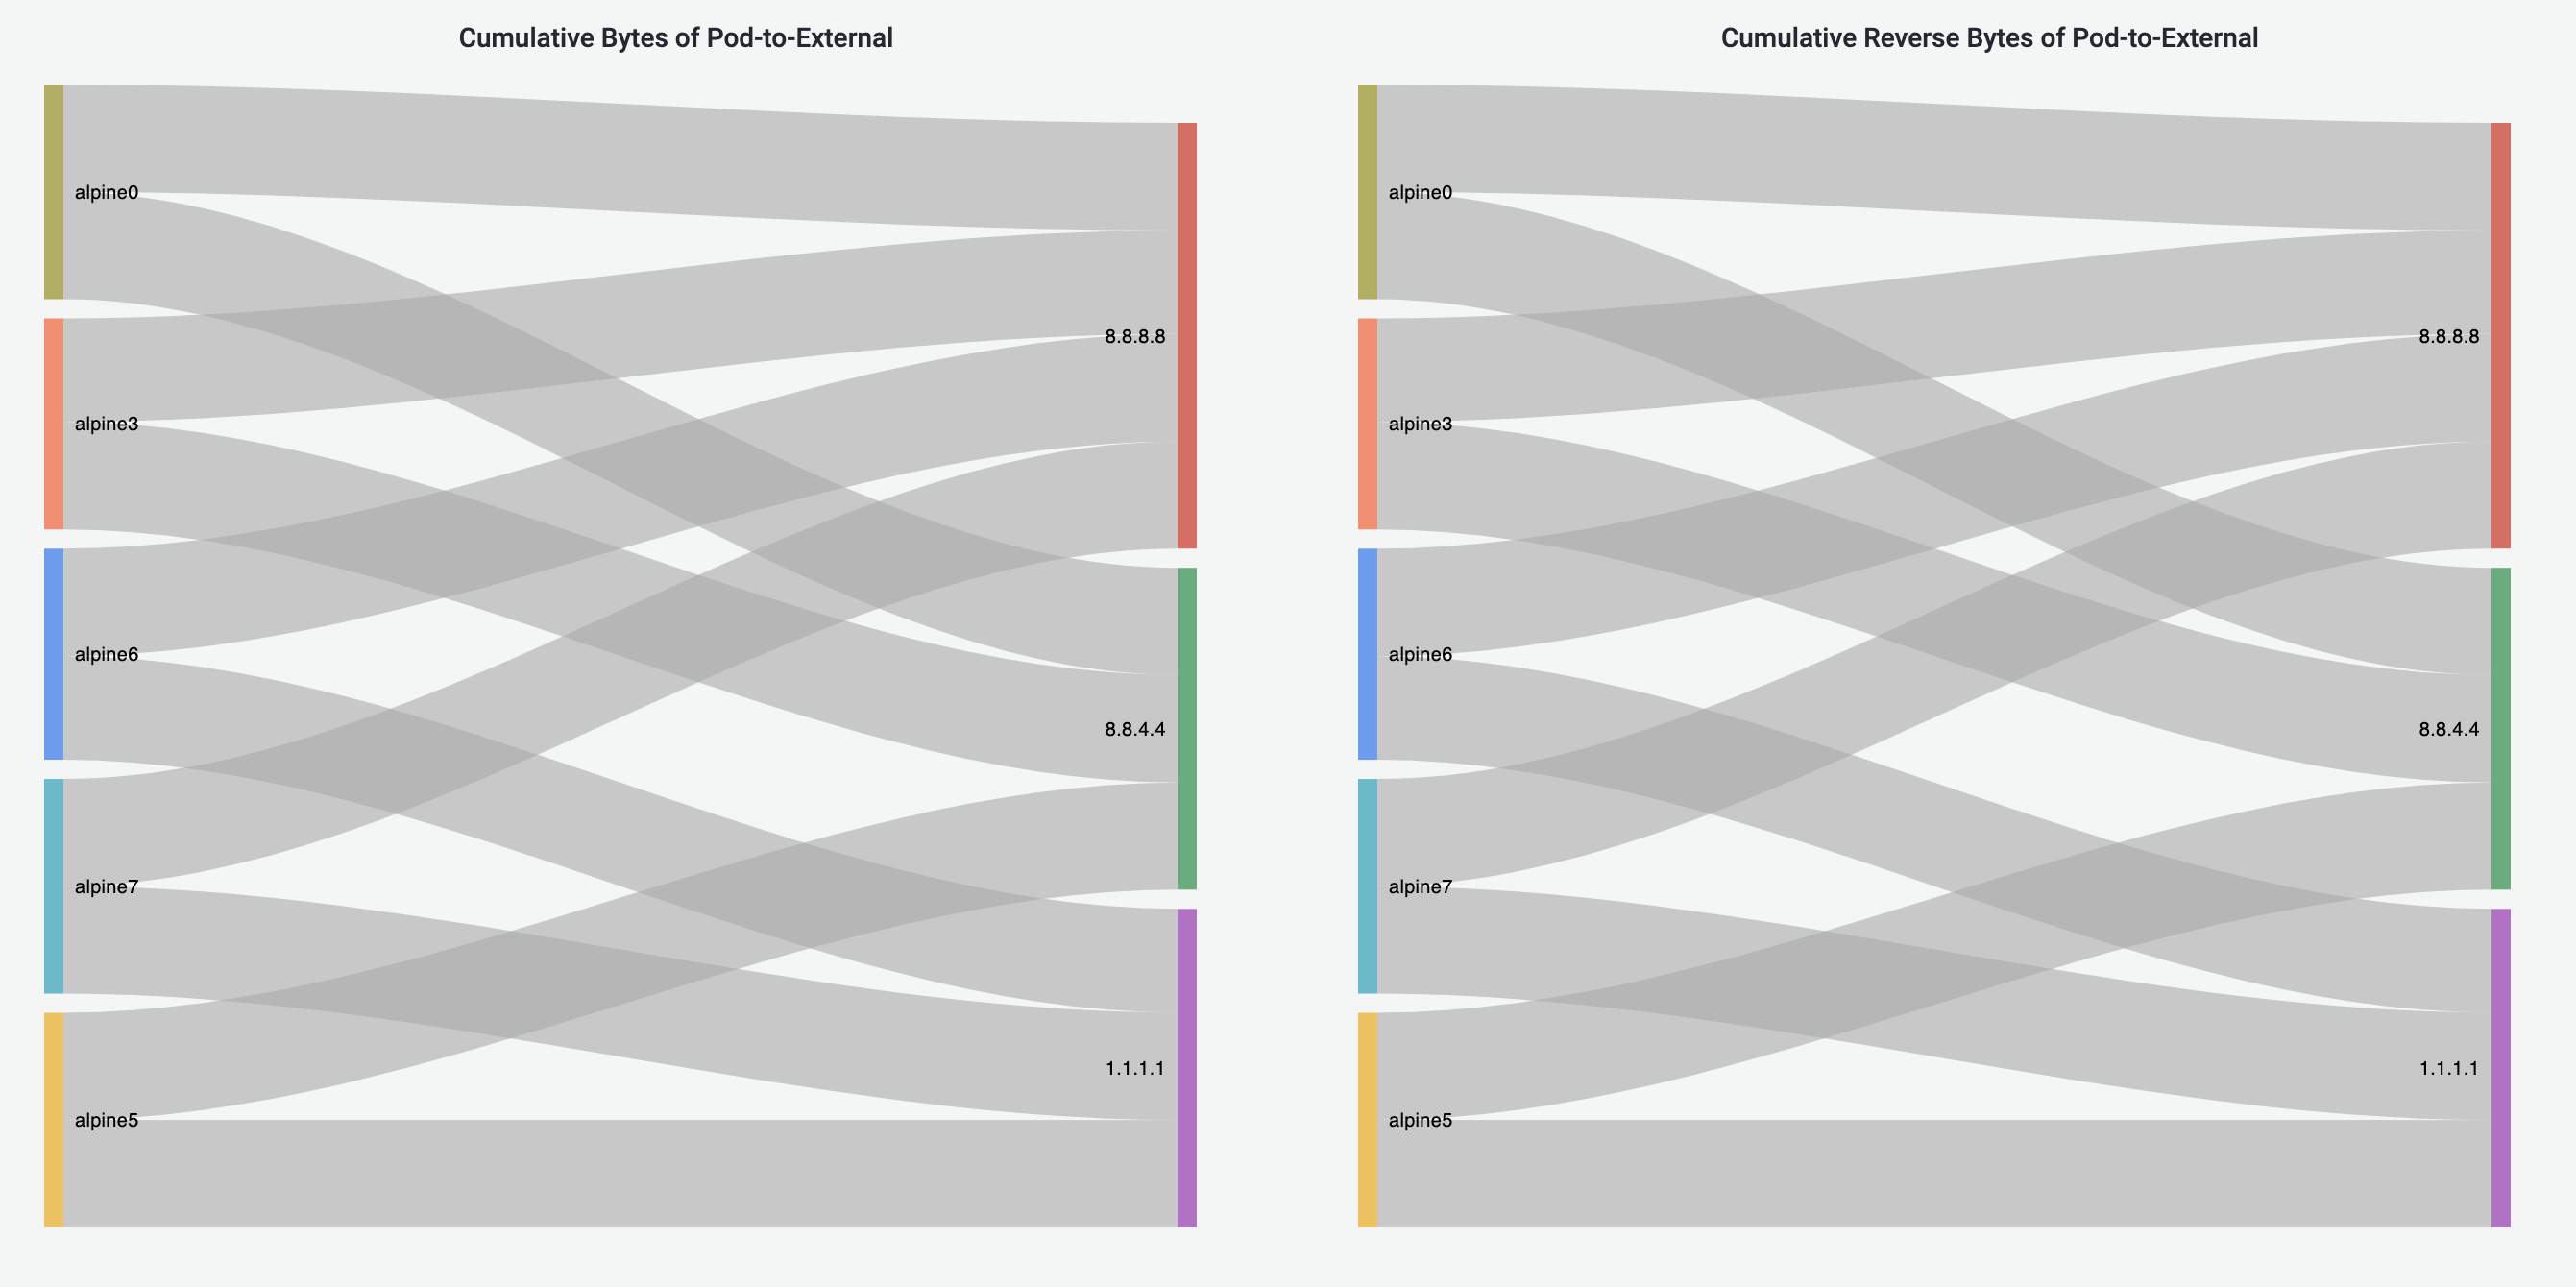
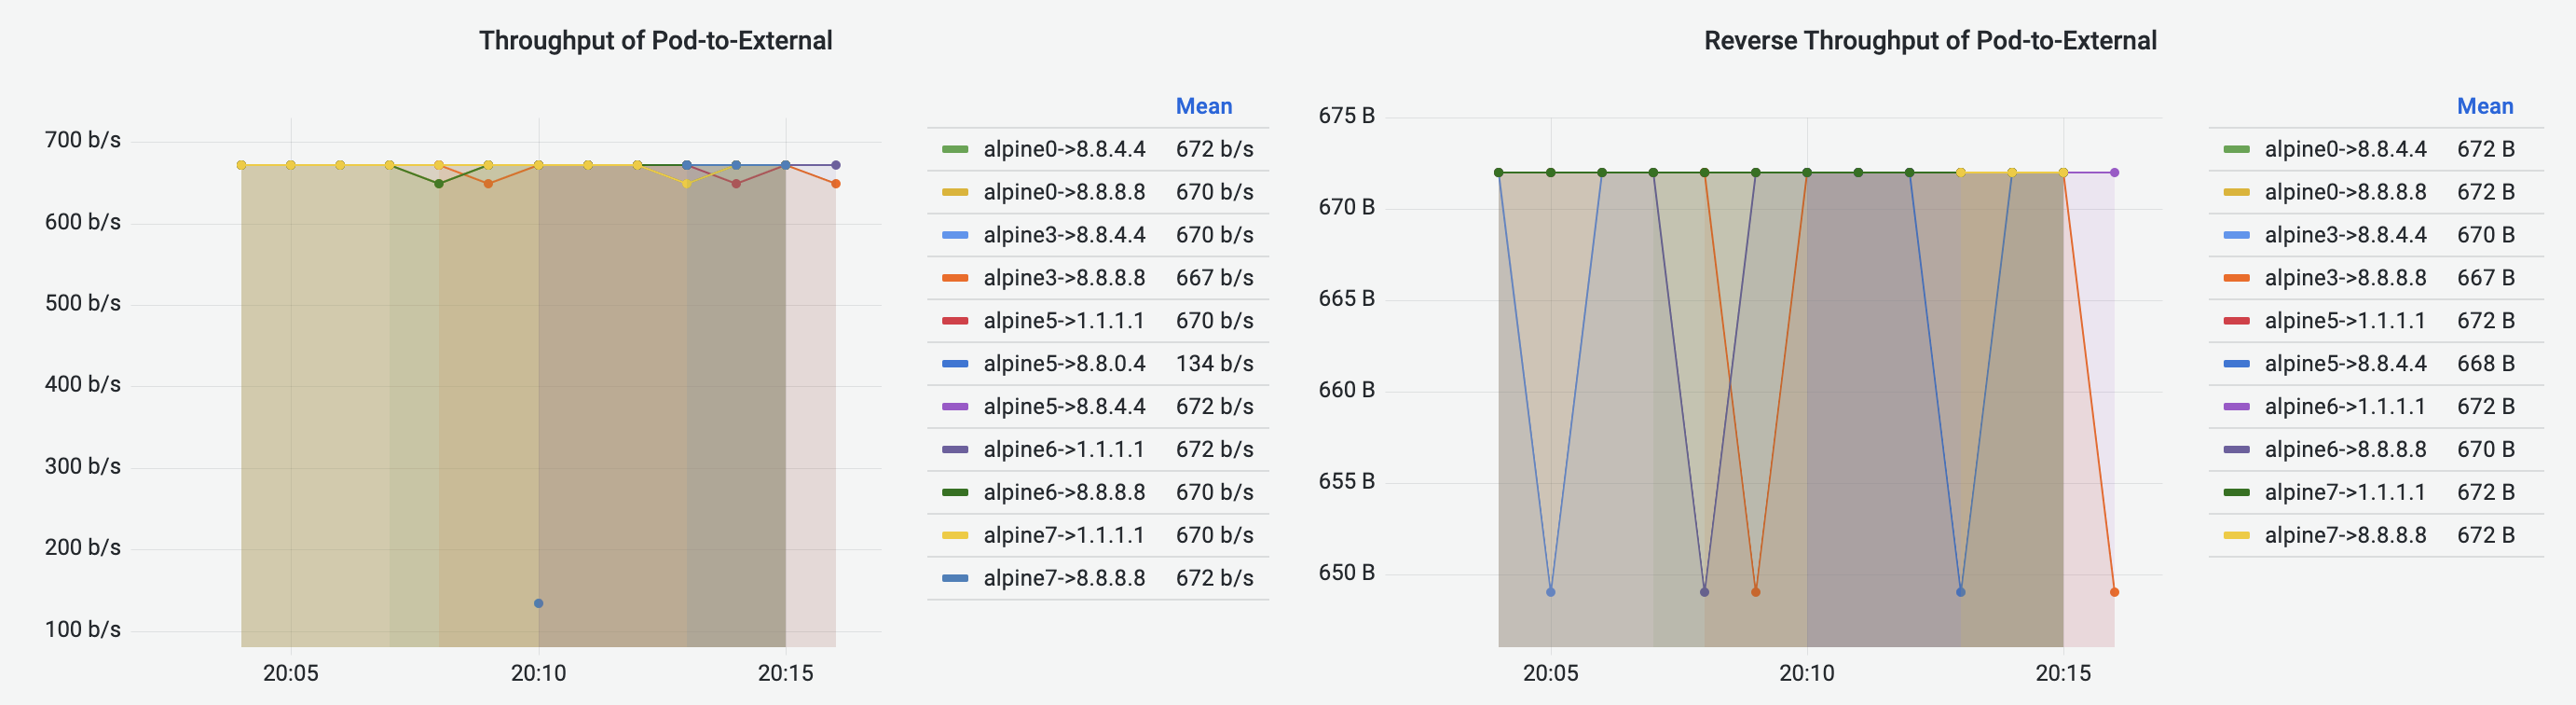
Pod-to-External Flows Dashboard
Pod-to-External Flows Dashboard has similar visualization to Pod-to-Pod Flows Dashboard, visualizing the Pod-to-External flows. The destination of a traffic flow is represented by the destination IP address.
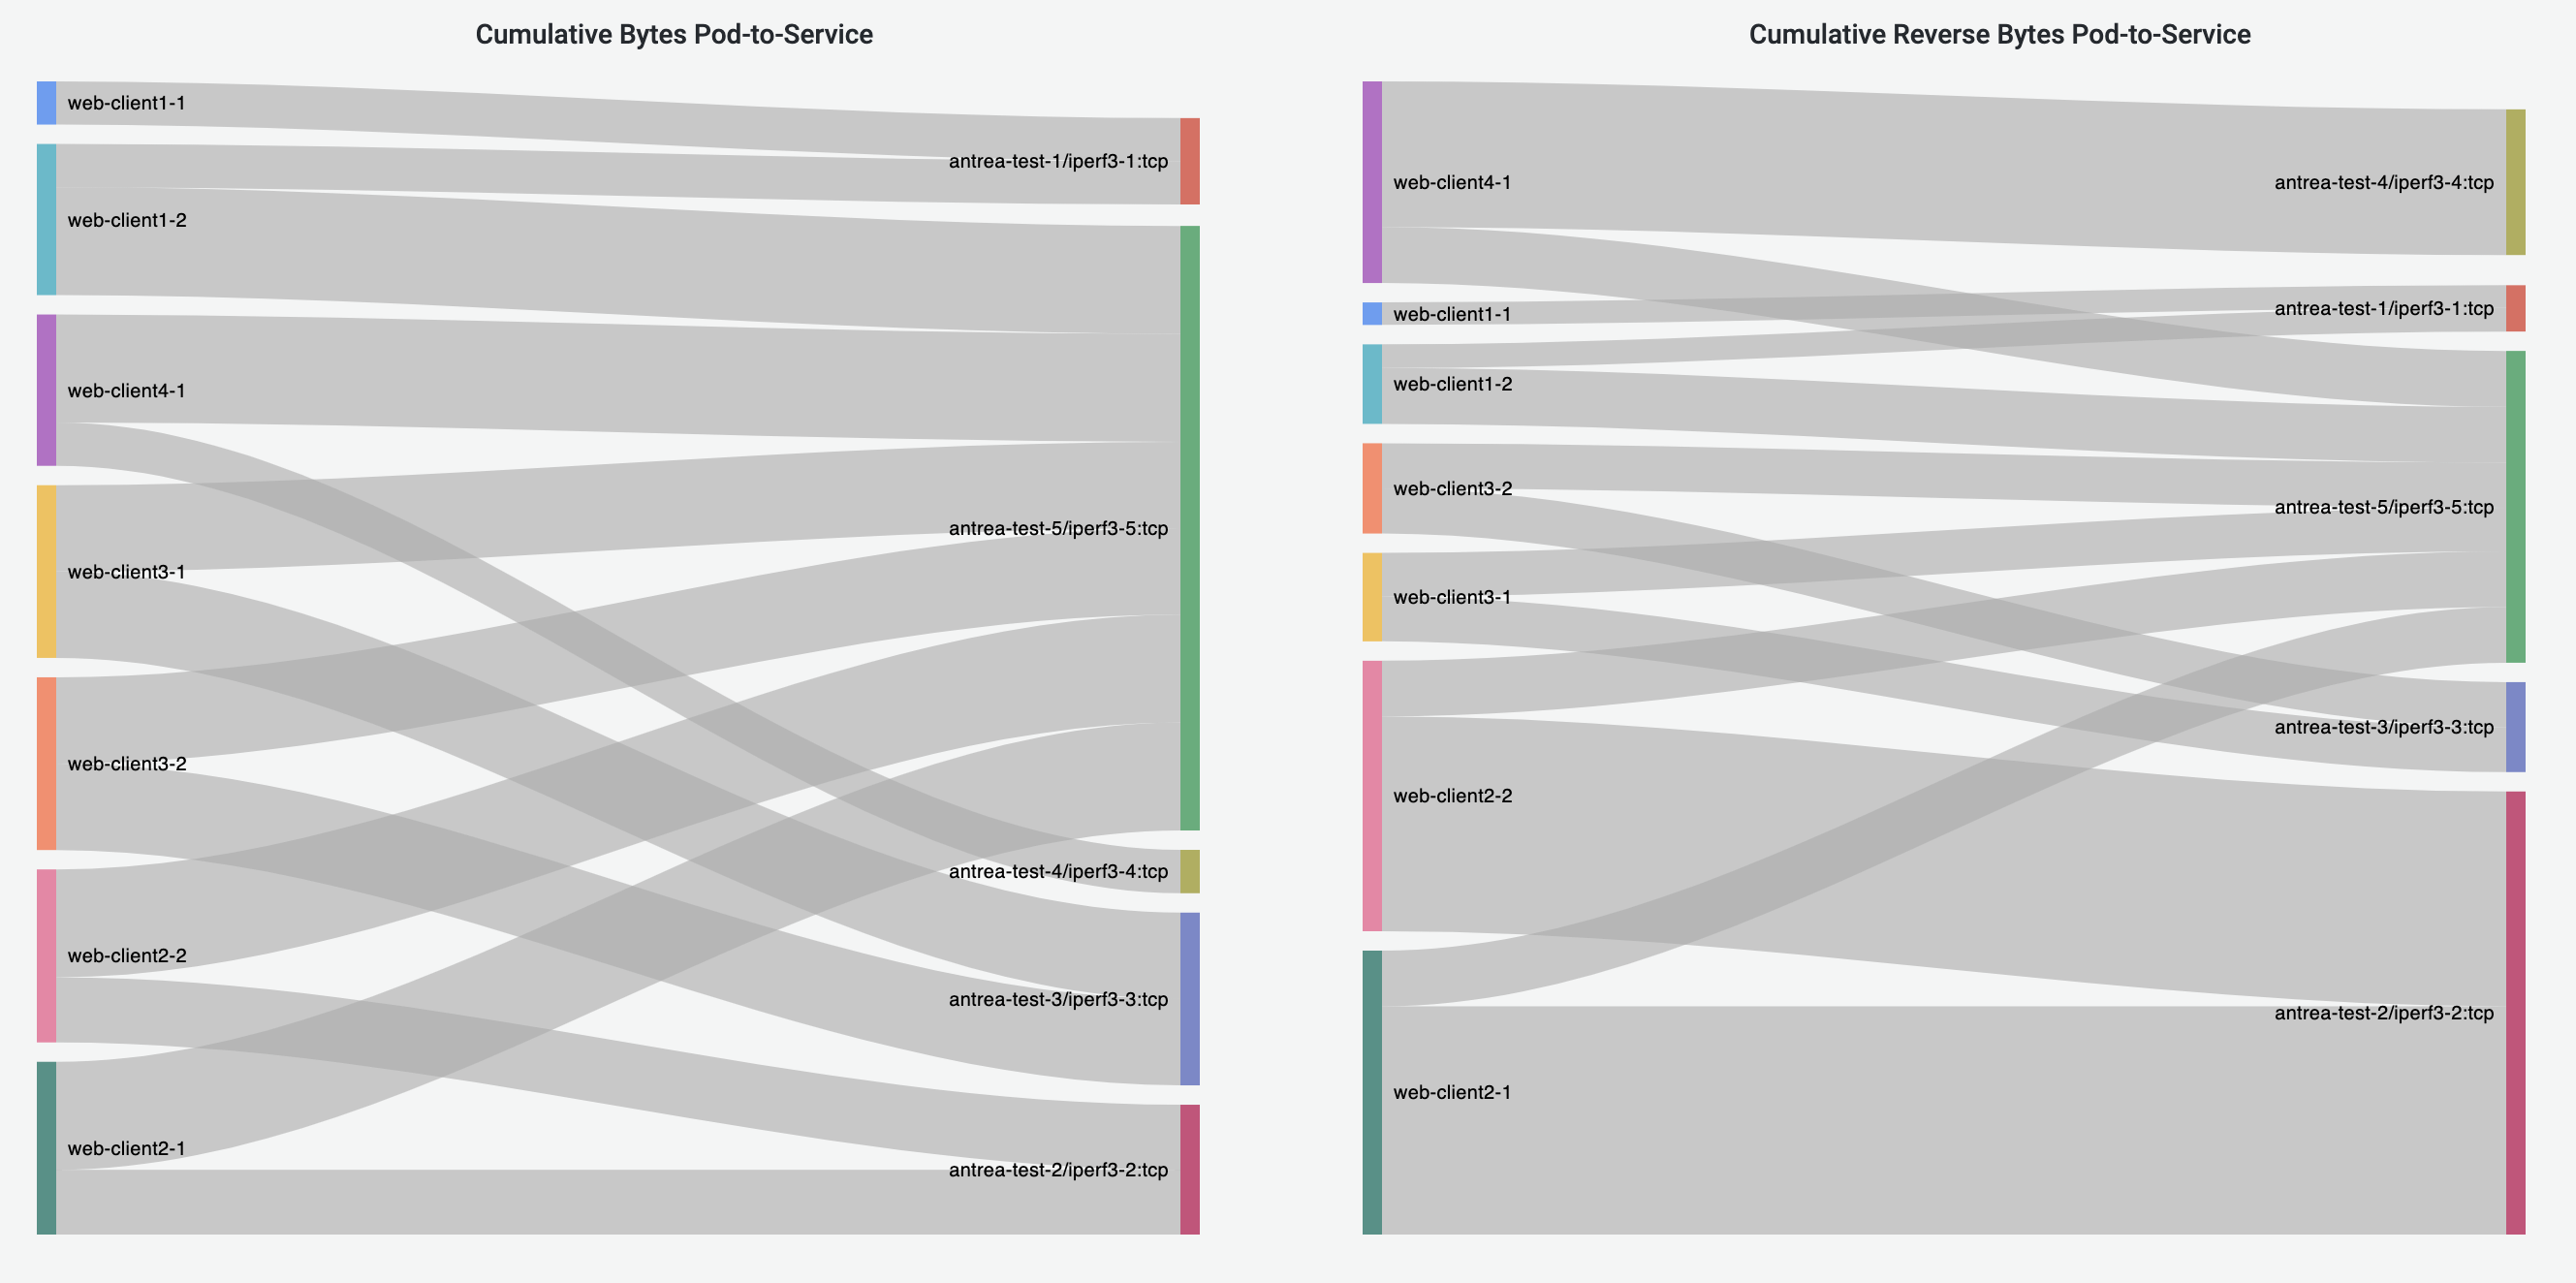
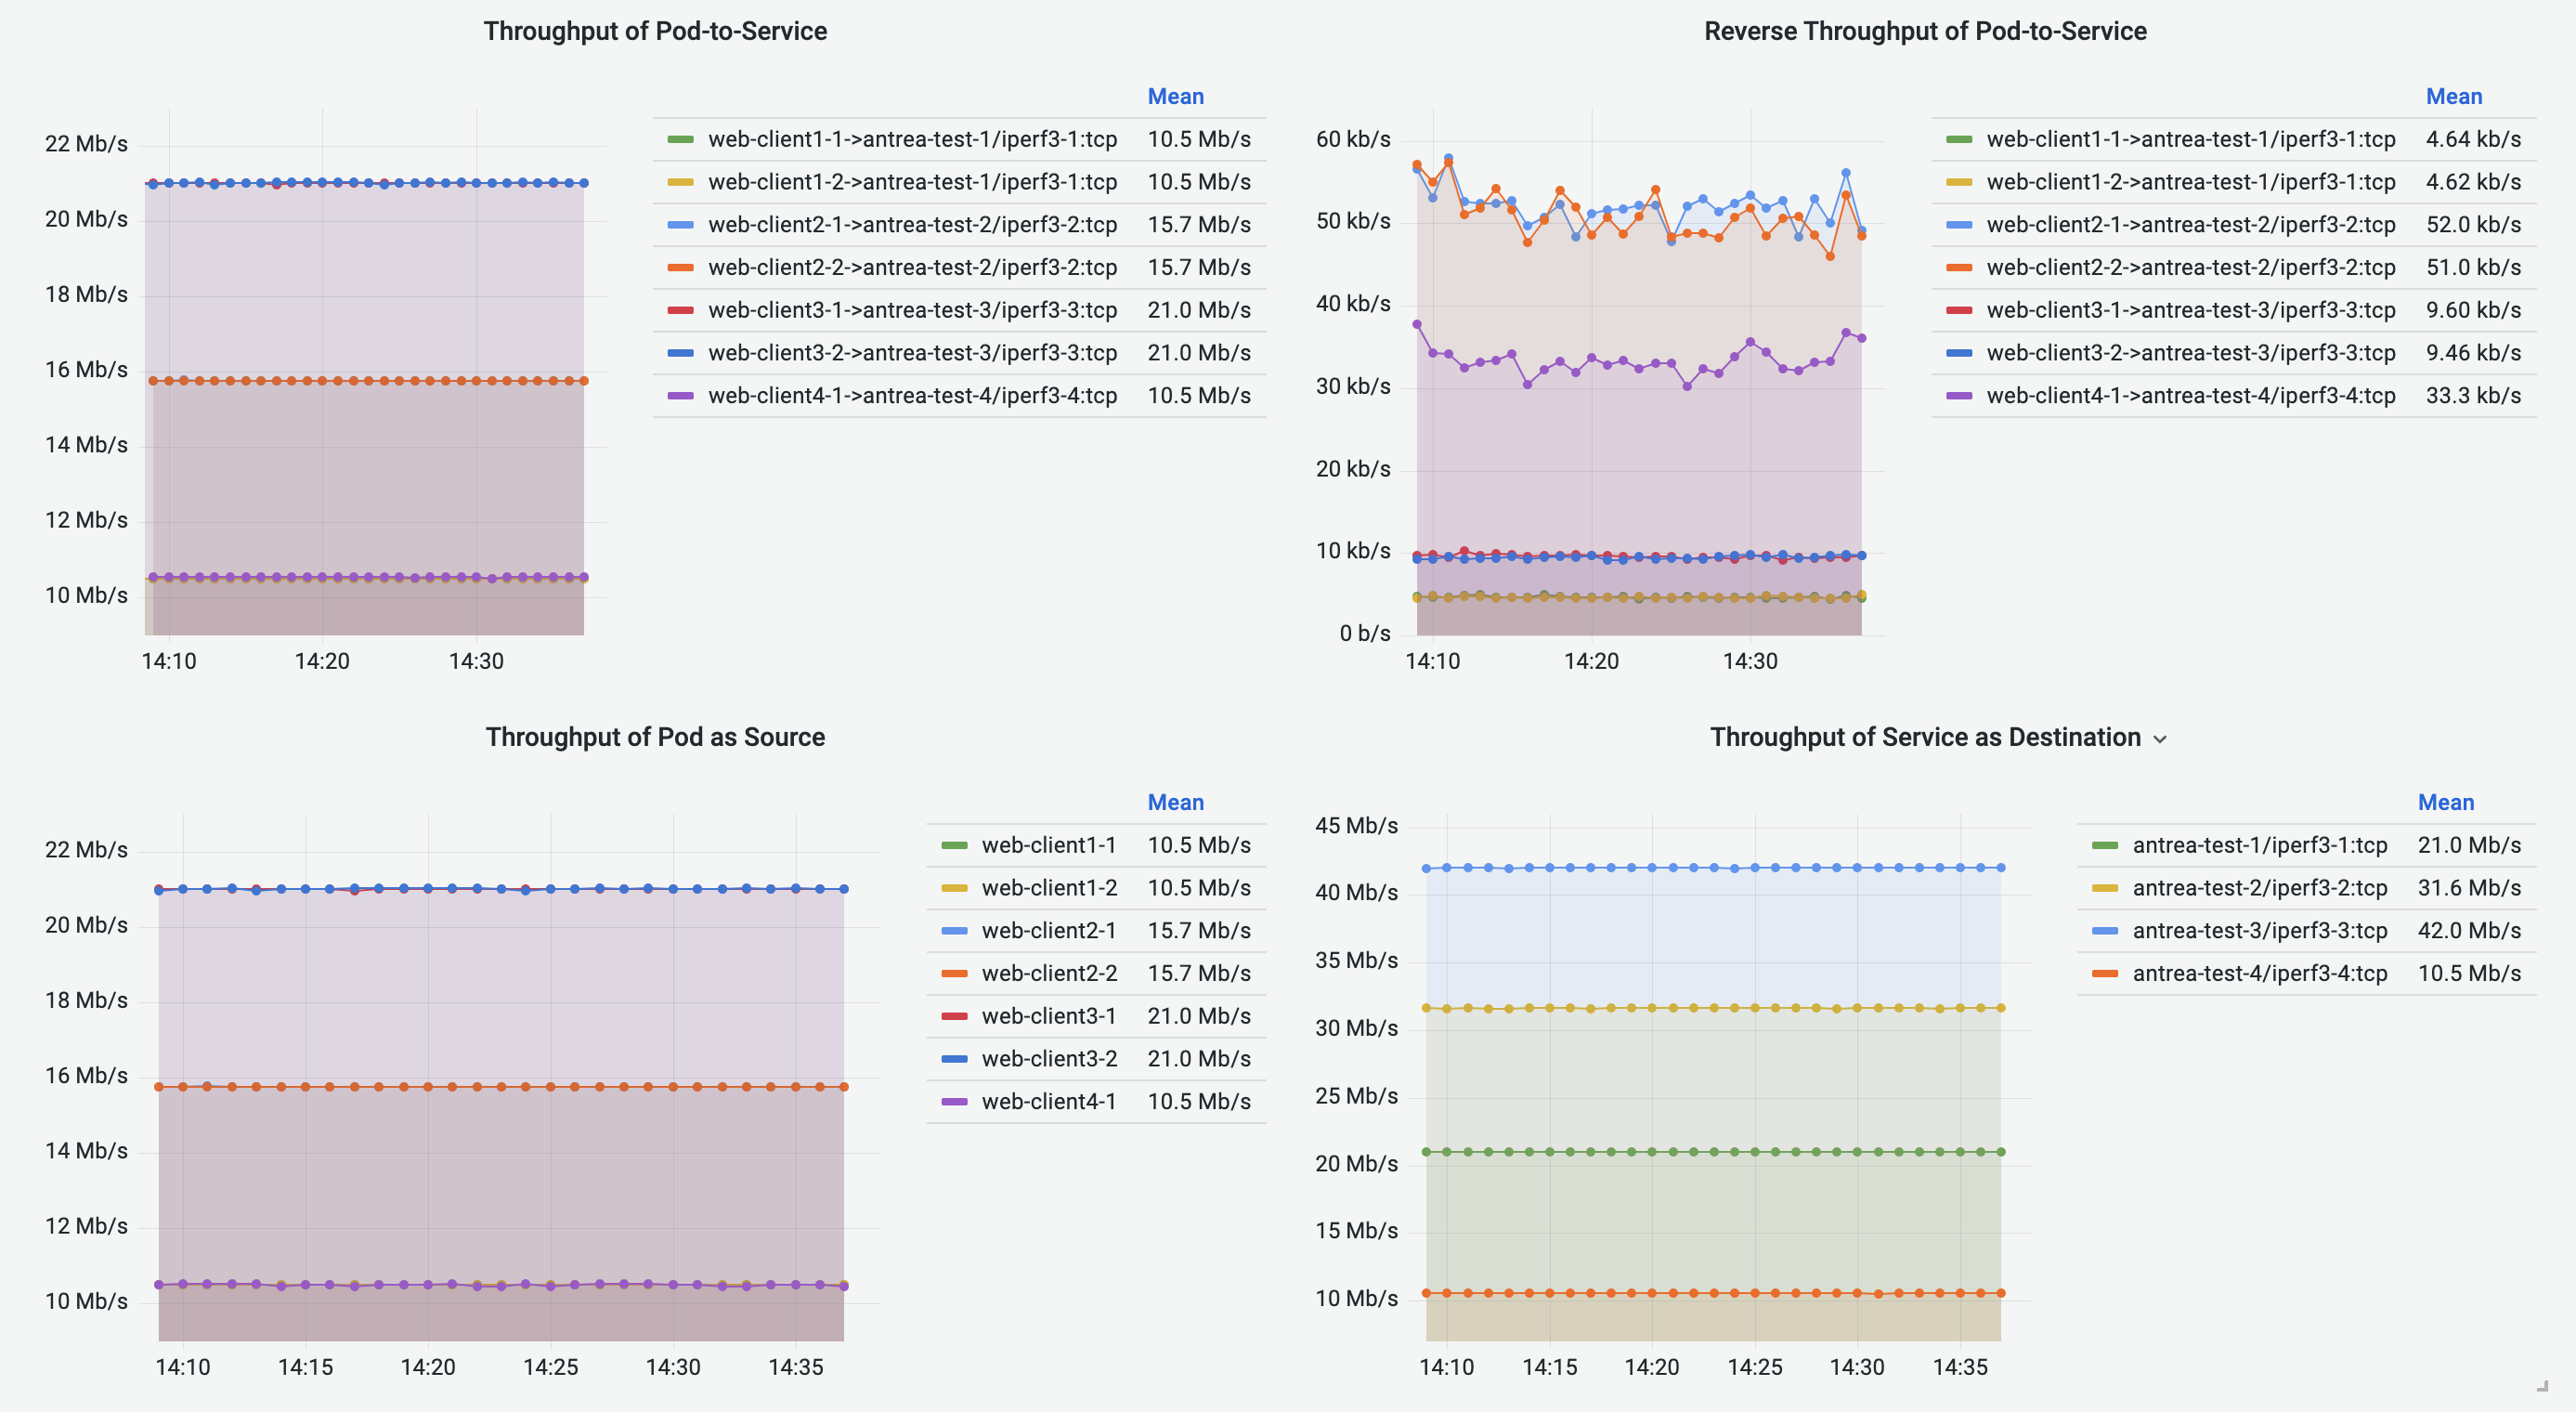
Pod-to-Service Flows Dashboard
Pod-to-Service Flows Dashboard shares the similar visualizations with Pod-to-Pod/External Flows Dashboard, visualizing the Pod-to-Service flows. The destination of a traffic is represented by the destination Service metadata.
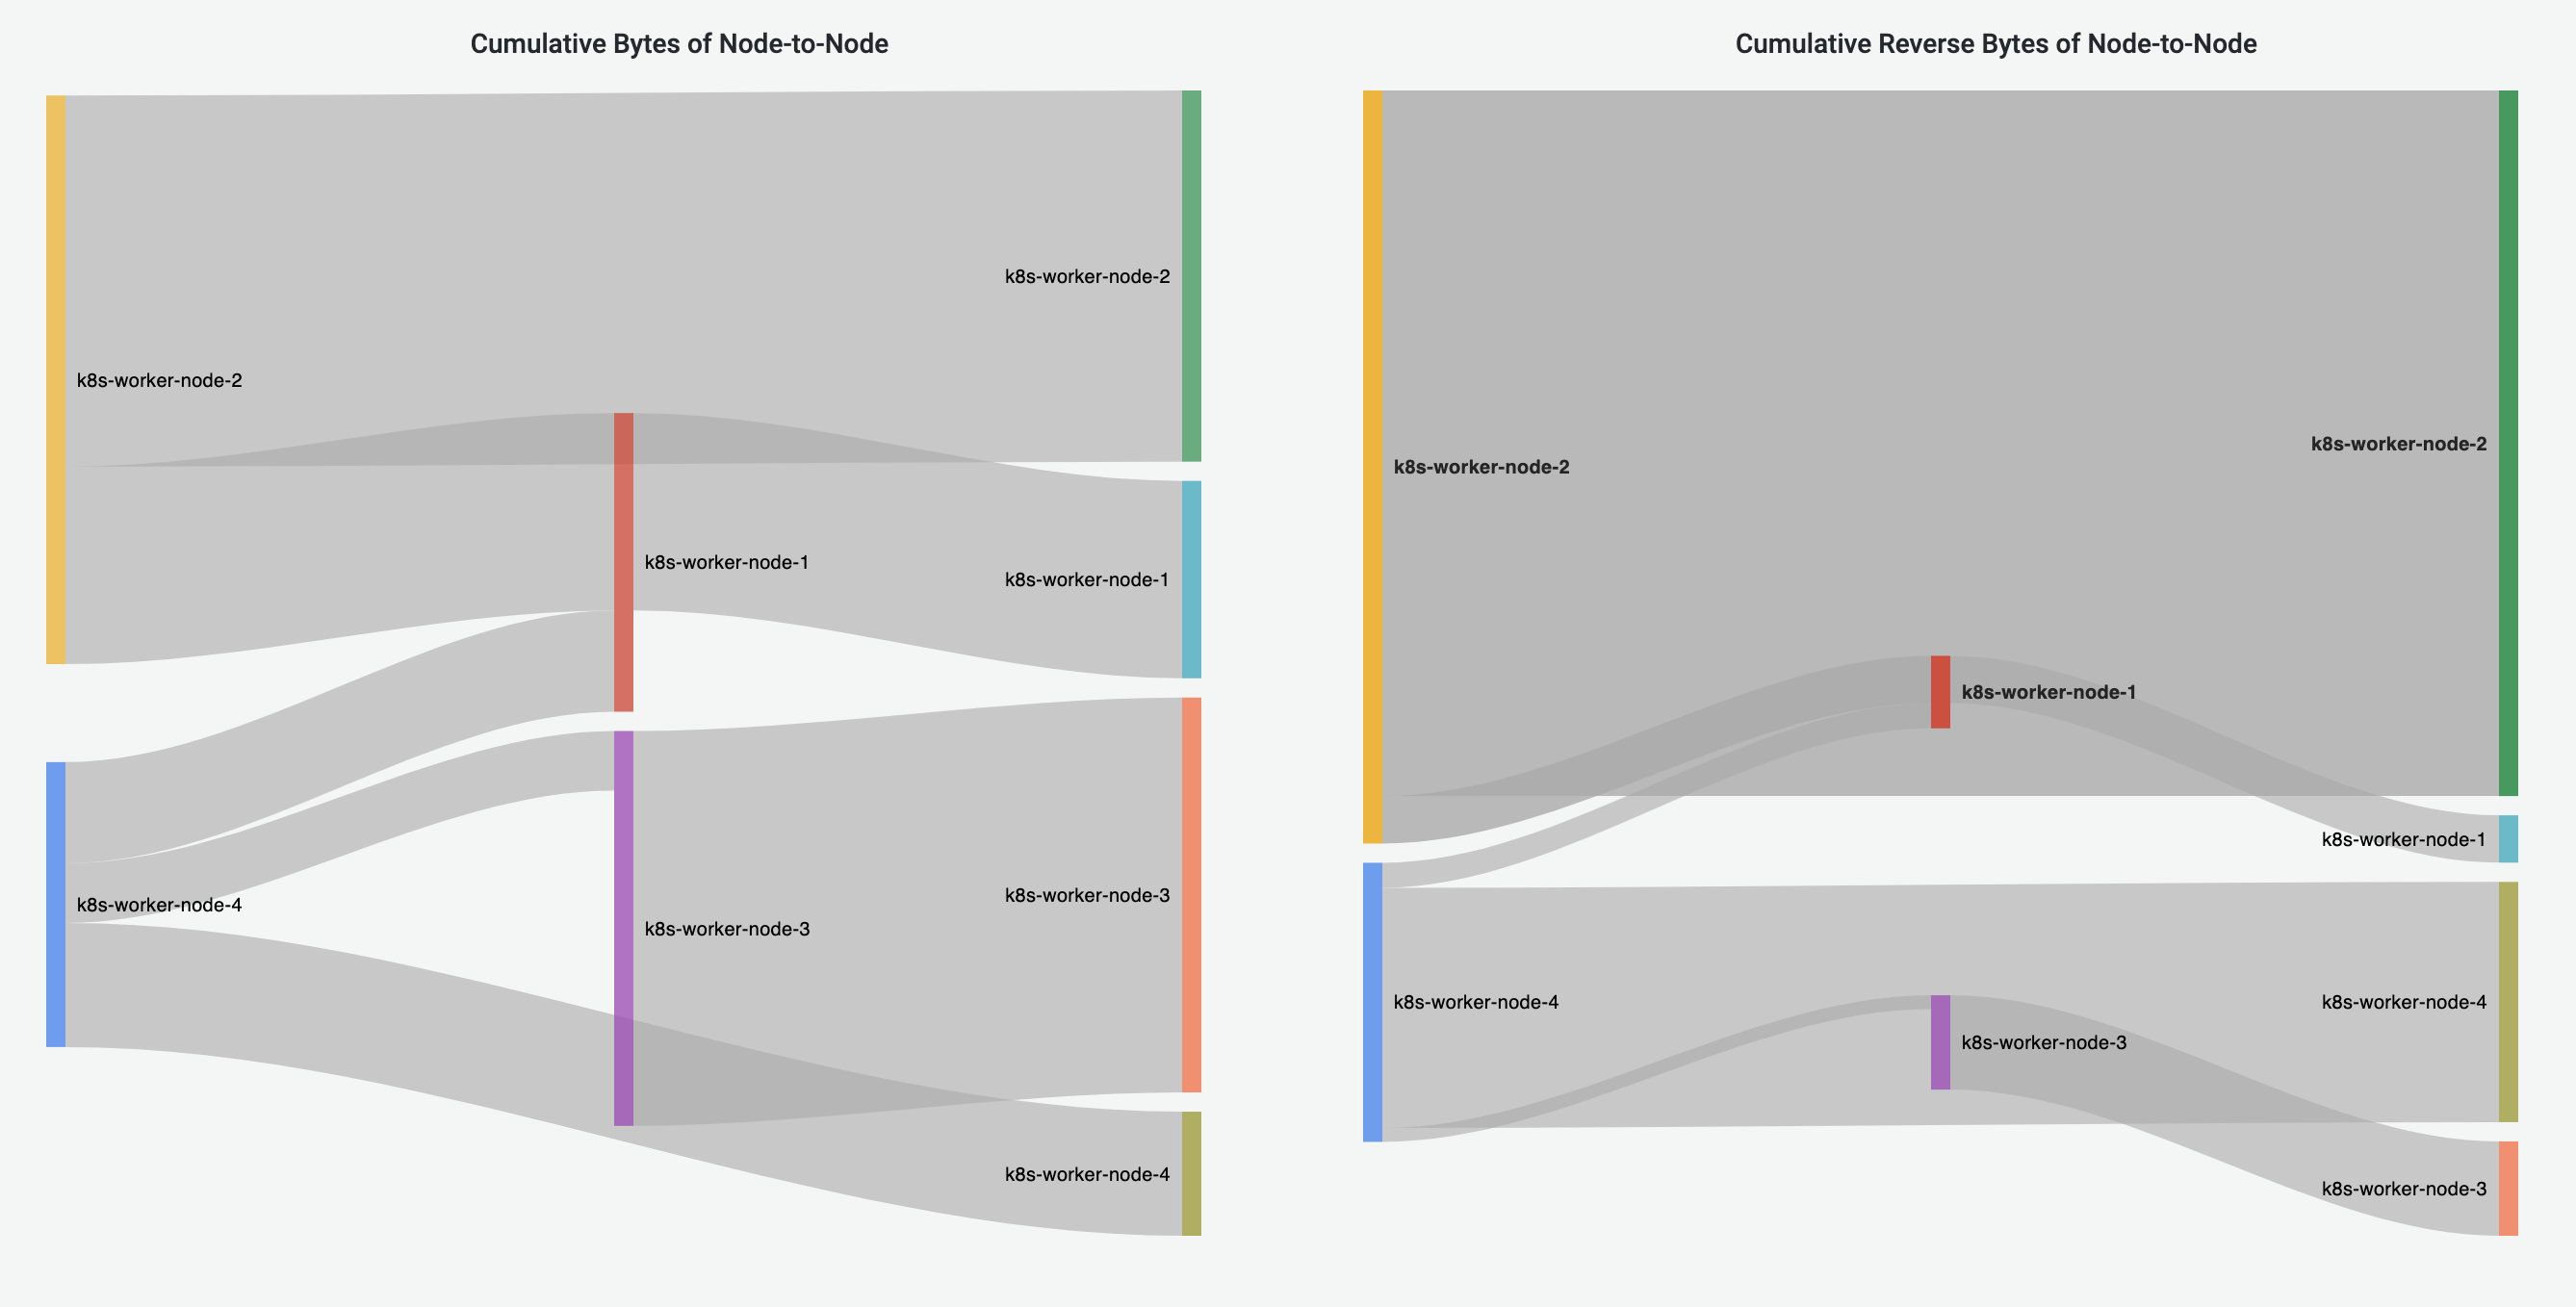
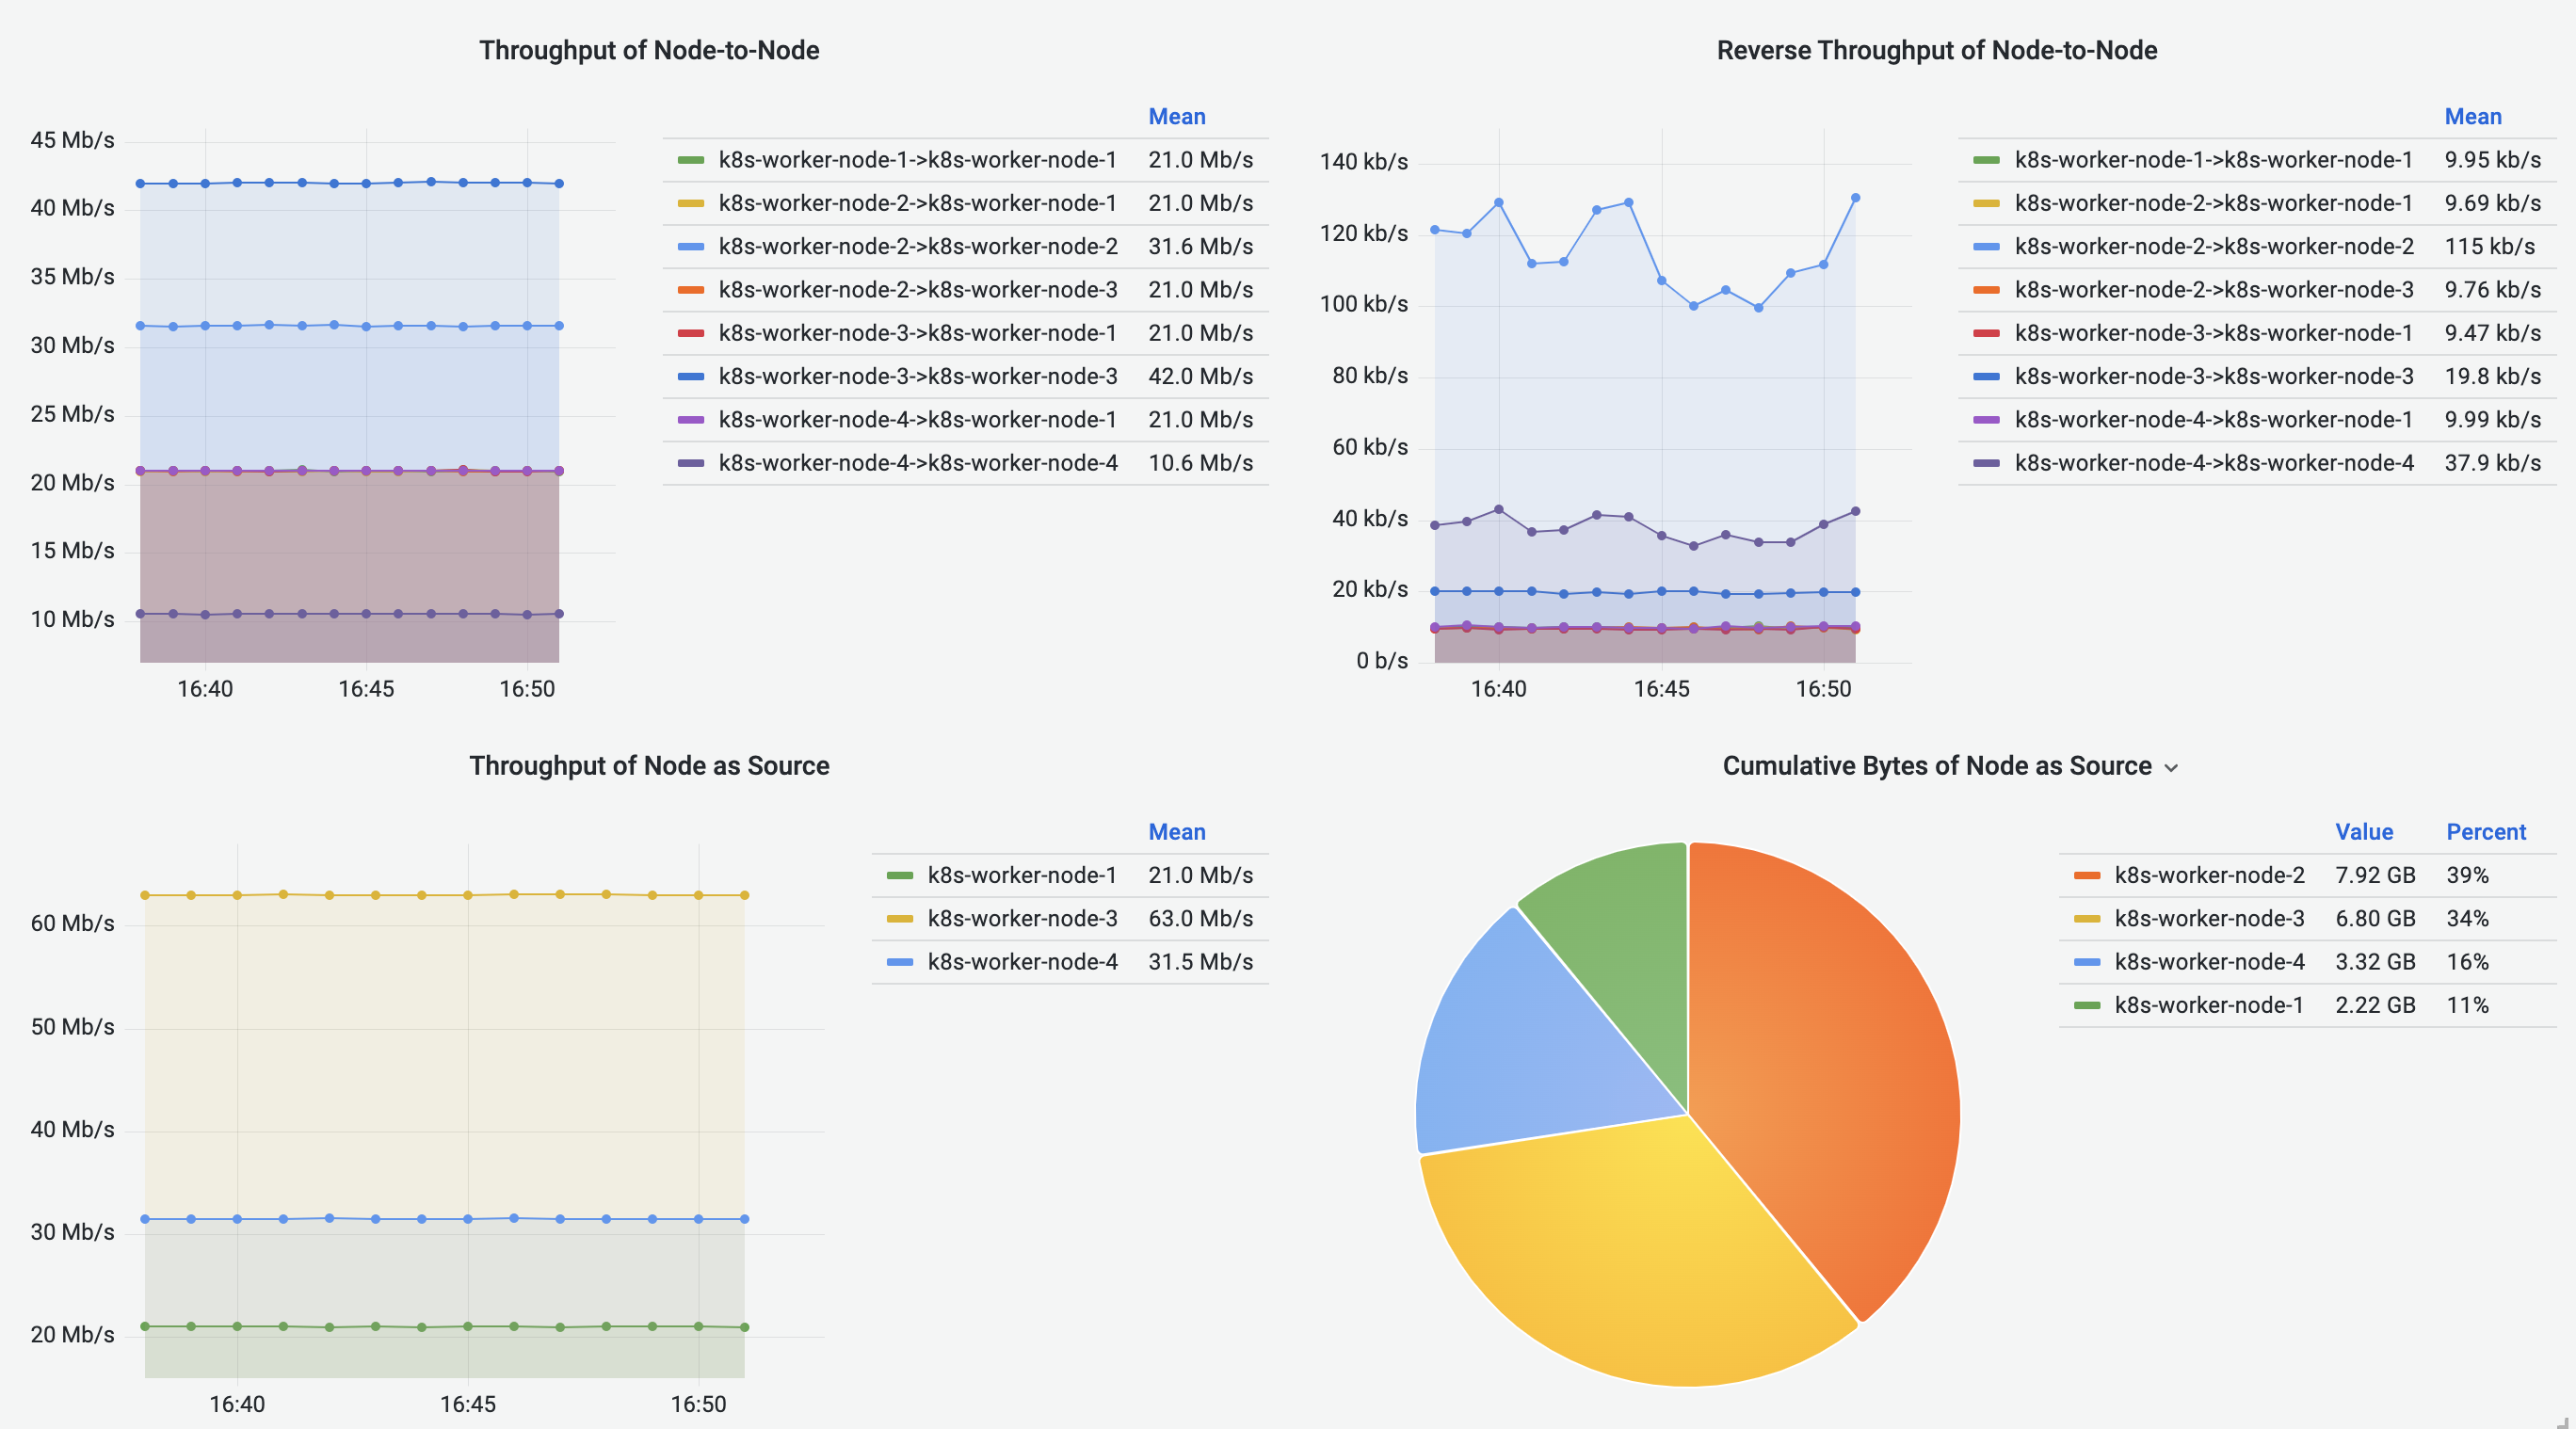
Node-to-Node Flows Dashboard
Node-to-Node Flows Dashboard visualizes the Node-to-Node traffic, including intra-Node and inter-Node flows. Cumulative bytes are shown in the Sankey diagrams and pie charts, and throughput is shown in the line graphs.
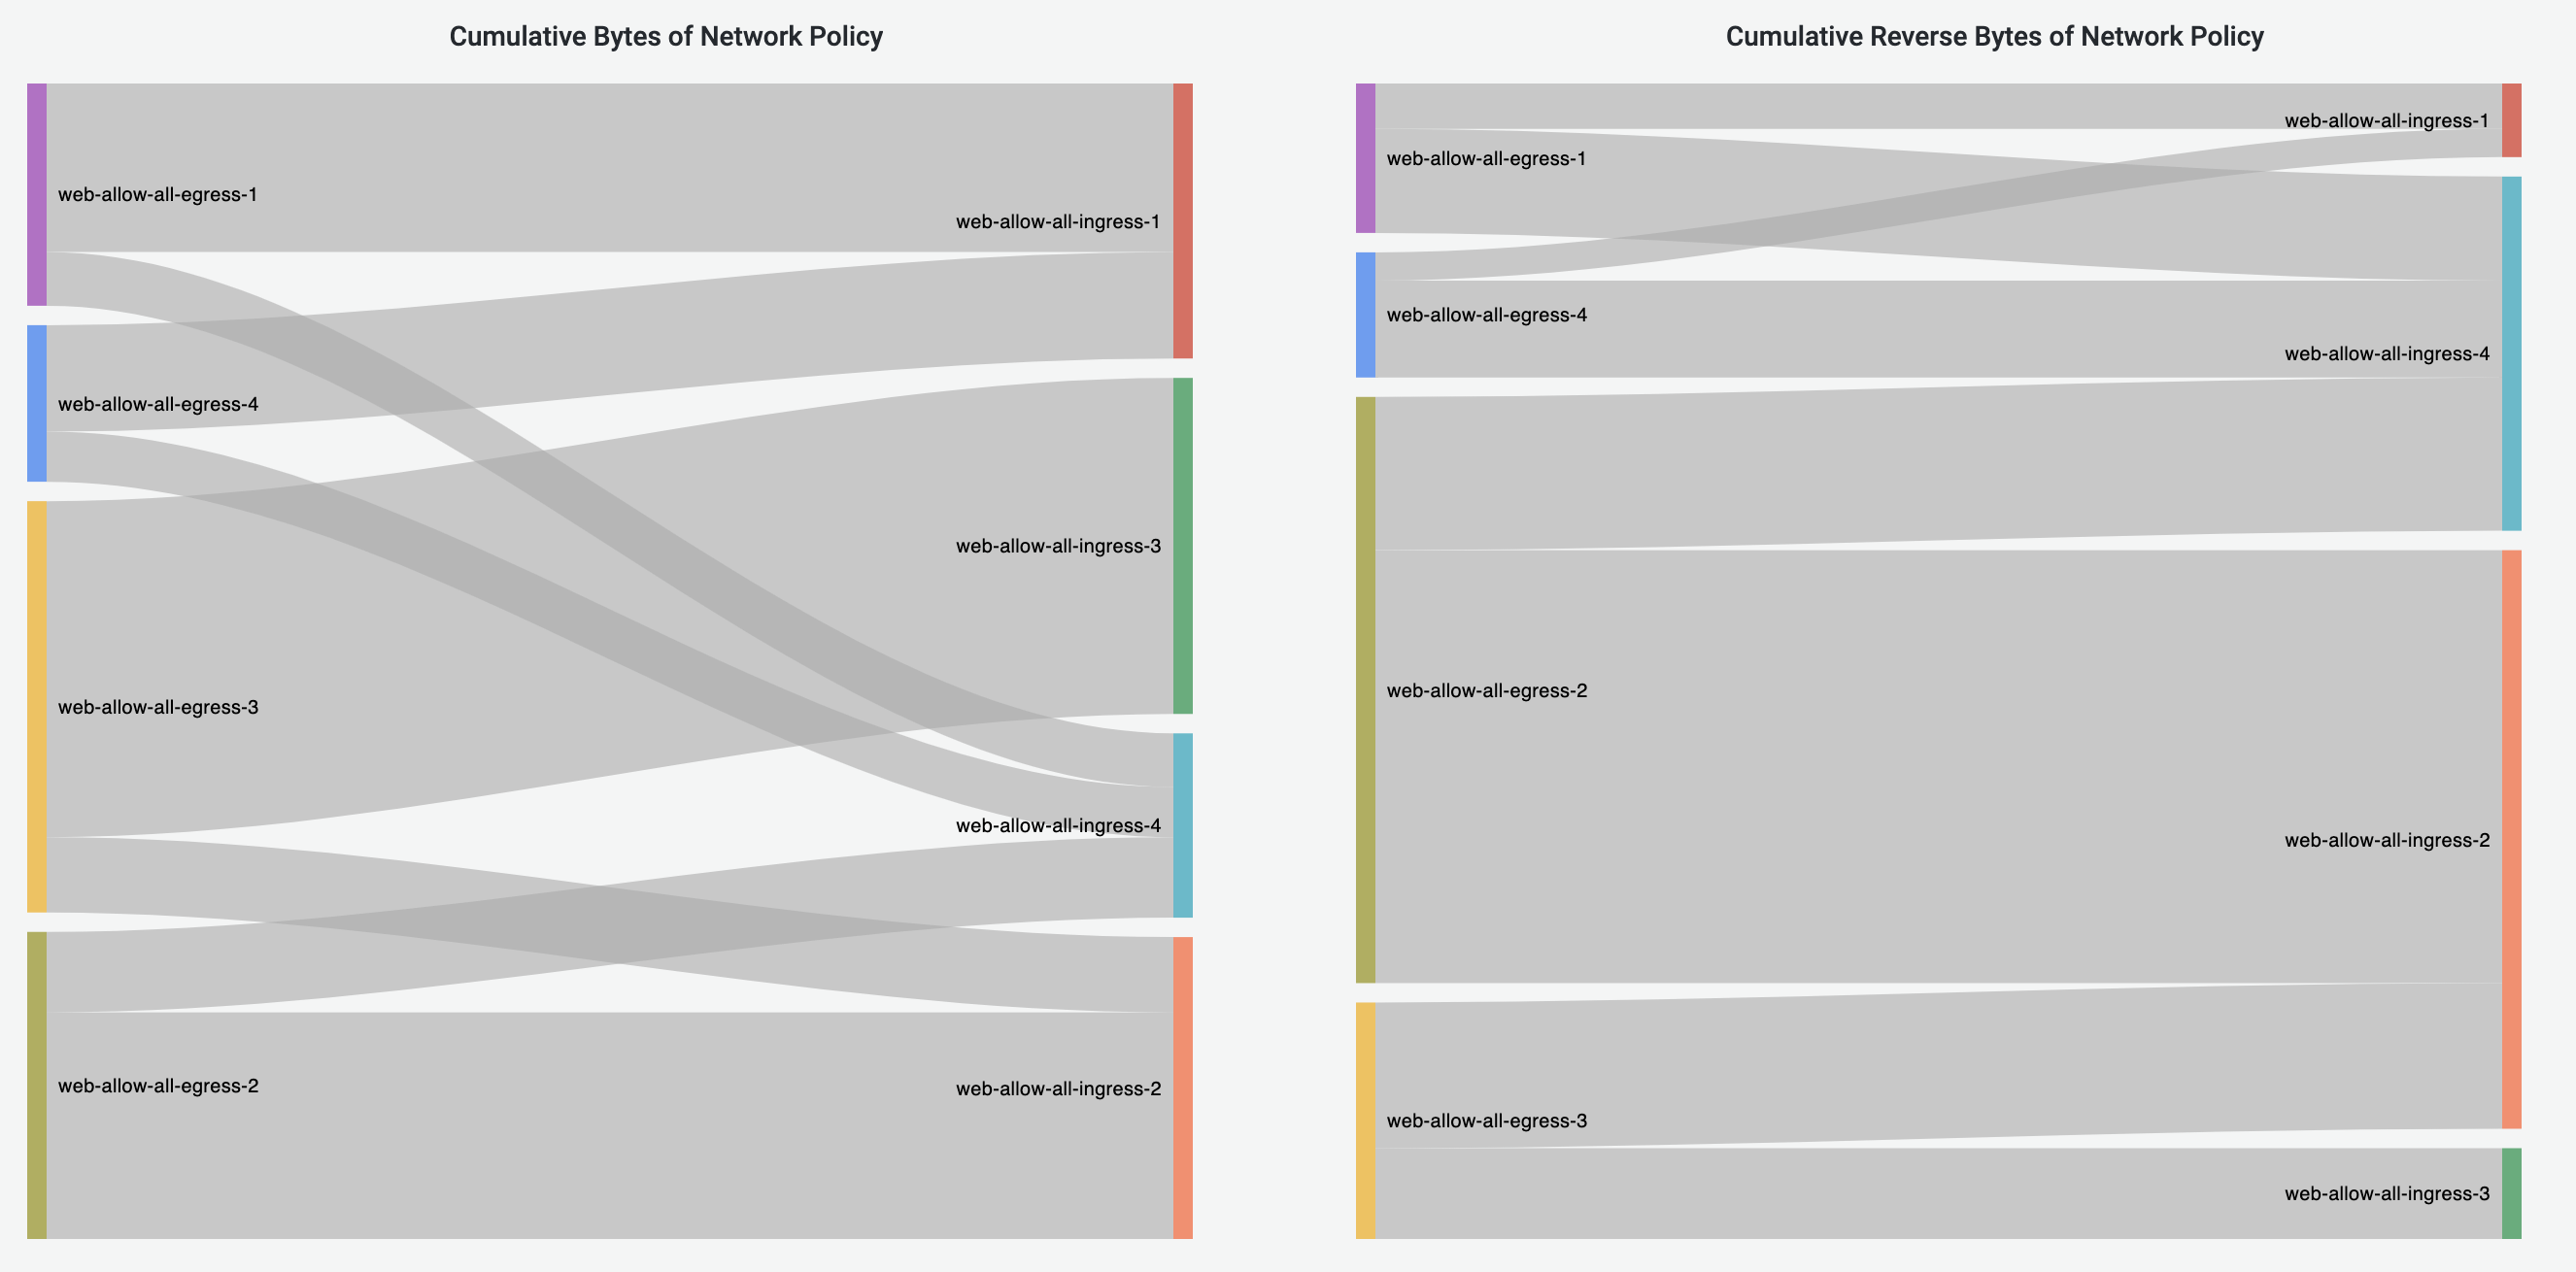
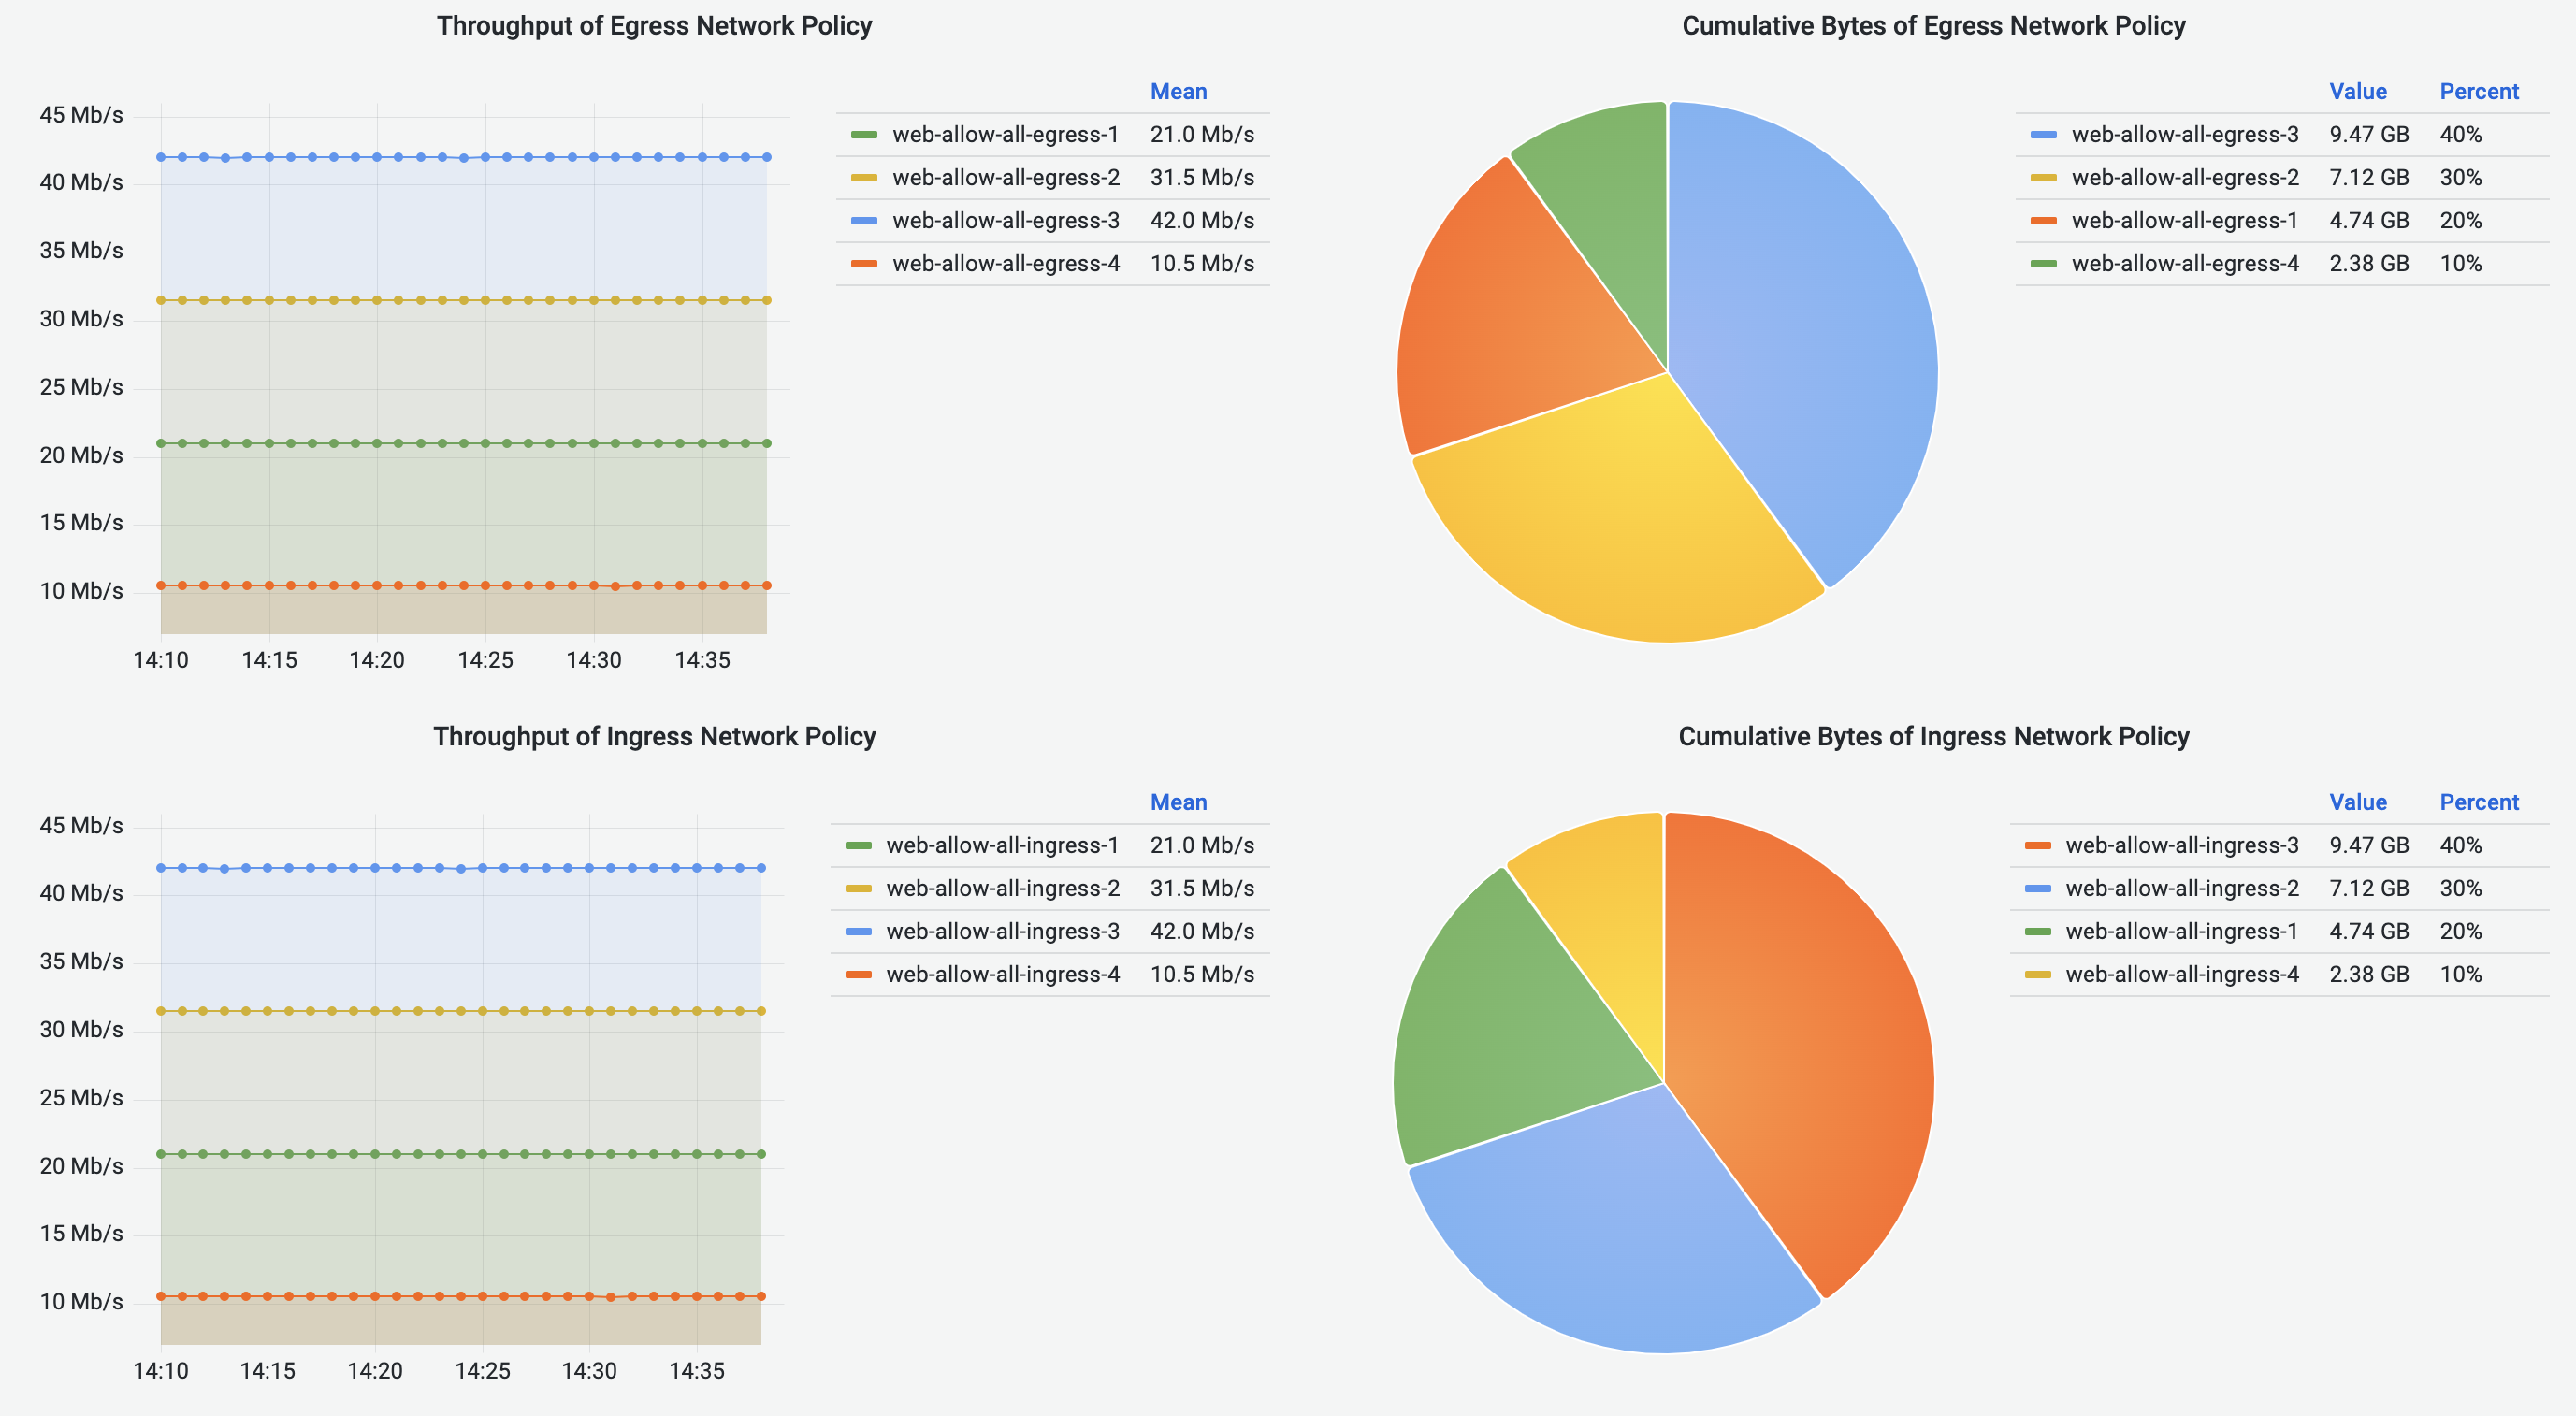
Network-Policy Flows Dashboard
Network-Policy Flows Dashboard visualizes the traffic with NetworkPolicies enforced.
Currently we only support the visualization of NetworkPolicies with Allow action.
Dashboards Customization
If you would like to make any changes to any of the pre-built dashboards, or build a new dashboard, please follow this doc on how to build a dashboard.
By clicking on the “Save dashboard” button in the Grafana UI, the changes to the dashboards will be persisted in the Grafana database at runtime, but they will be lost after restarting the Grafana deployment. To restore those changes after a restart, as the first step, you will need to export the dashboard JSON file following the doc, then there are two ways to import the dashboard depending on your needs:
- In the running Grafana UI, manually import the dashboard JSON files.
- If you want the changed dashboards to be automatically provisioned in Grafana like our pre-built dashboards, generate a deployment manifest with the changes by following the steps below:
-
Clone the repository. Exported dashboard JSON files should be placed under
antrea/build/yamls/flow-visibility/base/provisioning/dashboards. -
If a new dashboard is added, edit kustomization.yml by adding the file in the following section:
- name: grafana-dashboard-config files: - provisioning/dashboards/flow_records_dashboard.json - provisioning/dashboards/pod_to_pod_dashboard.json - provisioning/dashboards/pod_to_service_dashboard.json - provisioning/dashboards/pod_to_external_dashboard.json - provisioning/dashboards/node_to_node_dashboard.json - provisioning/dashboards/networkpolicy_allow_dashboard.json - provisioning/dashboards/[new_dashboard_name].json -
Generate the new YAML manifest by running:
./hack/generate-manifest-flow-visibility.sh > build/yamls/flow-visibility.yml
ELK Flow Collector (removed)
Starting with Antrea v1.7, support for the ELK Flow Collector has been removed. Please consider using the Grafana Flow Collector instead, which is actively maintained.