Documentation
Introduction
Cloud Deployment
Reference
- Antrea Network Policy
- antctl
- Architecture
- Traffic Encryption (Ipsec / WireGuard)
- Securing Control Plane
- Troubleshooting
- OS-specific Known Issues
- OVS Pipeline
- Feature Gates
- Network Flow Visibility
- Traceflow Guide
- NoEncap and Hybrid Traffic Modes
- Egress Guide
- NodePortLocal Guide
- Versioning
- Antrea API Groups
- Antrea API Reference
Windows
Integrations
Cookbooks
Developer Guide
Project Information
Network Flow Visibility in Antrea
Table of Contents
Overview
Antrea is a Kubernetes network plugin that provides network connectivity and security features for Pod workloads. Considering the scale and dynamism of Kubernetes workloads in a cluster, Network Flow Visibility helps in the management and configuration of Kubernetes resources such as Network Policy, Services, Pods etc., and thereby provides opportunities to enhance the performance and security aspects of Pod workloads.
For visualizing the network flows, Antrea monitors the flows in Linux conntrack module. These flows are converted to flow records, and then flow records are post-processed before they are sent to the configured external flow collector. High-level design is given below:

Flow Exporter
In Antrea, the basic building block for the Network Flow Visibility is the Flow Exporter. Flow Exporter operates within Antrea Agent; it builds and maintains a connection store by polling and dumping flows from conntrack module periodically. Connections from the connection store are exported to the Flow Aggregator Service using the IPFIX protocol, and for this purpose we use the IPFIX exporter process from the go-ipfix library.
Configuration
To enable the Flow Exporter feature at the Antrea Agent, the following config parameters have to be set in the Antrea Agent ConfigMap:
  antrea-agent.conf: |
    # FeatureGates is a map of feature names to bools that enable or disable experimental features.
    featureGates:
    # Enable flowexporter which exports polled conntrack connections as IPFIX flow records from each agent to a configured collector.
      FlowExporter: true

    # Provide the IPFIX collector address as a string with format <HOST>:[<PORT>][:<PROTO>].
    # HOST can either be the DNS name or the IP of the Flow Collector. For example,
    # "flow-aggregator.flow-aggregator.svc" can be provided as a DNS name to connect
    # to the Antrea Flow Aggregator Service. If IP, it can be either IPv4 or IPv6.
    # However, IPv6 address should be wrapped with [].
    # If PORT is empty, we default to 4739, the standard IPFIX port.
    # If no PROTO is given, we consider "tls" as default. We support "tls", "tcp" and
    # "udp" protocols. "tls" is used for securing communication between flow exporter and
    # flow aggregator.
    #flowCollectorAddr: "flow-aggregator.flow-aggregator.svc:4739:tls"

    # Provide flow poll interval as a duration string. This determines how often the
    # flow exporter dumps connections from the conntrack module. Flow poll interval
    # should be greater than or equal to 1s (one second).
    # Valid time units are "ns", "us" (or "µs"), "ms", "s", "m", "h".
    #flowPollInterval: "5s"

    # Provide the active flow export timeout, which is the timeout after which a flow
    # record is sent to the collector for active flows. Thus, for flows with a continuous
    # stream of packets, a flow record will be exported to the collector once the elapsed
    # time since the last export event is equal to the value of this timeout.
    # Valid time units are "ns", "us" (or "µs"), "ms", "s", "m", "h".
    #activeFlowExportTimeout: "60s"

    # Provide the idle flow export timeout, which is the timeout after which a flow
    # record is sent to the collector for idle flows. A flow is considered idle if no
    # packet matching this flow has been observed since the last export event.
    # Valid time units are "ns", "us" (or "µs"), "ms", "s", "m", "h".
    #idleFlowExportTimeout: "15s"
Please note that the default value for flowCollectorAddr is "flow-aggregator.flow-aggregator.svc:4739:tls",
which uses the DNS name of the Flow Aggregator Service, if the Service is deployed
with the Name and Namespace set to flow-aggregator. For Antrea Agent running on
a Windows node, the user is required to change the default value of HOST in flowCollectorAddr
from DNS name to the Cluster IP of the Flow Aggregator service. The reason is because
on Windows the Antrea Agent runs as a process, it uses the host’s default DNS setting and the DNS
resolver will not be configured to talk to the CoreDNS Service for cluster local DNS queries like
flow-aggregator.flow-aggregator.svc. In addition, if you deploy the Flow Aggregator Service
with a different Name and Namespace, then either use the appropriate DNS name or the Cluster IP of
the Service.
Please note that the default values for
flowPollInterval, activeFlowExportTimeout, and idleFlowExportTimeout parameters are set to 5s, 60s, and 15s, respectively.
TLS communication between the Flow Exporter and the Flow Aggregator is enabled by default.
Please modify them as per your requirements.
IPFIX Information Elements (IEs) in a Flow Record
There are 34 IPFIX IEs in each exported flow record, which are defined in the IANA-assigned IE registry, the Reverse IANA-assigned IE registry and the Antrea IE registry. The reverse IEs are used to provide bi-directional information about the flow. The Enterprise ID is 0 for IANA-assigned IE registry, 29305 for reverse IANA IE registry, 56505 for Antrea IE registry. All the IEs used by the Antrea Flow Exporter are listed below:
IEs from IANA-assigned IE Registry
| IPFIX Information Element | Field ID | Type |
|---|---|---|
| flowStartSeconds | 150 | dateTimeSeconds |
| flowEndSeconds | 151 | dateTimeSeconds |
| flowEndReason | 136 | unsigned8 |
| sourceIPv4Address | 8 | ipv4Address |
| destinationIPv4Address | 12 | ipv4Address |
| sourceIPv6Address | 27 | ipv6Address |
| destinationIPv6Address | 28 | ipv6Address |
| sourceTransportPort | 7 | unsigned16 |
| destinationTransportPort | 11 | unsigned16 |
| protocolIdentifier | 4 | unsigned8 |
| packetTotalCount | 86 | unsigned64 |
| octetTotalCount | 85 | unsigned64 |
| packetDeltaCount | 2 | unsigned64 |
| octetDeltaCount | 1 | unsigned64 |
IEs from Reverse IANA-assigned IE Registry
| IPFIX Information Element | Field ID | Type |
|---|---|---|
| reversePacketTotalCount | 86 | unsigned64 |
| reverseOctetTotalCount | 85 | unsigned64 |
| reversePacketDeltaCount | 2 | unsigned64 |
| reverseOctetDeltaCount | 1 | unsigned64 |
IEs from Antrea IE Registry
| IPFIX Information Element | Field ID | Type | Description |
|---|---|---|---|
| sourcePodNamespace | 100 | string | |
| sourcePodName | 101 | string | |
| destinationPodNamespace | 102 | string | |
| destinationPodName | 103 | string | |
| sourceNodeName | 104 | string | |
| destinationNodeName | 105 | string | |
| destinationClusterIPv4 | 106 | ipv4Address | |
| destinationClusterIPv6 | 107 | ipv6Address | |
| destinationServicePort | 108 | unsigned16 | |
| destinationServicePortName | 109 | string | |
| ingressNetworkPolicyName | 110 | string | Name of the ingress network policy applied to the destination Pod for this flow. |
| ingressNetworkPolicyNamespace | 111 | string | Namespace of the ingress network policy applied to the destination Pod for this flow. |
| ingressNetworkPolicyType | 115 | unsigned8 | 1 stands for Kubernetes Network Policy. 2 stands for Antrea Network Policy. 3 stands for Antrea Cluster Network Policy. |
| ingressNetworkPolicyRuleName | 141 | string | Name of the ingress network policy Rule applied to the destination Pod for this flow. |
| egressNetworkPolicyName | 112 | string | Name of the egress network policy applied to the source Pod for this flow. |
| egressNetworkPolicyNamespace | 113 | string | Namespace of the egress network policy applied to the source Pod for this flow. |
| egressNetworkPolicyType | 118 | unsigned8 | |
| egressNetworkPolicyRuleName | 142 | string | Name of the egress network policy rule applied to the source Pod for this flow. |
| ingressNetworkPolicyRuleAction | 139 | unsigned8 | 1 stands for Allow. 2 stands for Drop. 3 stands for Reject. |
| egressNetworkPolicyRuleAction | 140 | unsigned8 | |
| tcpState | 136 | string | The state of the TCP connection. The states are: LISTEN, SYN-SENT, SYN-RECEIVED, ESTABLISHED, FIN-WAIT-1, FIN-WAIT-2, CLOSE-WAIT, CLOSING, LAST-ACK, TIME-WAIT, and CLOSED. |
| flowType | 137 | unsigned8 | 1 stands for Intra-Node. 2 stands for Inter-Node. 3 stands for To External. 4 stands for From External. |
Supported capabilities
Types of Flows and Associated Information
Currently, the Flow Exporter feature provides visibility for Pod-to-Pod, Pod-to-Service and Pod-to-External network flows along with the associated statistics such as data throughput (bits per second), packet throughput (packets per second), cumulative byte count and cumulative packet count. Pod-To-Service flow visibility is supported only when Antrea Proxy enabled, which is the case by default starting with Antrea v0.11. In the future, we will enable the support for External-To-Service flows.
Kubernetes information such as Node name, Pod name, Pod Namespace, Service name, NetworkPolicy name and NetworkPolicy Namespace, is added to the flow records. Network Policy Rule Action (Allow, Reject, Drop) is also supported for both Antrea-native NetworkPolicies and K8s NetworkPolicies. For K8s NetworkPolicies, connections dropped due to isolated Pod behavior will be assigned the Drop action. For flow records that are exported from any given Antrea Agent, the Flow Exporter only provides the information of Kubernetes entities that are local to the Antrea Agent. In other words, flow records are only complete for intra-Node flows, but incomplete for inter-Node flows. It is the responsibility of the Flow Aggregator to correlate flows from the source and destination Nodes and produce complete flow records.
Both Flow Exporter and Flow Aggregator are supported in IPv4 clusters, IPv6 clusters and dual-stack clusters.
Connection Metrics
We support following connection metrics as Prometheus metrics that are exposed
through
Antrea Agent apiserver endpoint:
antrea_agent_conntrack_total_connection_count,
antrea_agent_conntrack_antrea_connection_count,
antrea_agent_denied_connection_count,
antrea_agent_conntrack_max_connection_count, and
antrea_agent_flow_collector_reconnection_count
Flow Aggregator
Flow Aggregator is deployed as a Kubernetes Service. The main functionality of Flow Aggregator is to store, correlate and aggregate the flow records received from the Flow Exporter of Antrea Agents. More details on the functionality are provided in the Supported Capabilities section.
Flow Aggregator is implemented as IPFIX mediator, which consists of IPFIX Collector Process, IPFIX Intermediate Process and IPFIX Exporter Process. We use the go-ipfix library to implement the Flow Aggregator.
Deployment
To deploy a released version of Flow Aggregator Service, pick a deployment manifest from the
list of releases. For any
given release <TAG> (e.g. v0.12.0), you can deploy Flow Aggregator as follows:
kubectl apply -f https://github.com/antrea-io/antrea/releases/download/<TAG>/flow-aggregator.yml
To deploy the latest version of Flow Aggregator Service (built from the main branch), use the checked-in deployment yaml:
kubectl apply -f https://raw.githubusercontent.com/antrea-io/antrea/main/build/yamls/flow-aggregator.yml
Configuration
The following configuration parameters have to be provided through the Flow Aggregator
ConfigMap. externalFlowCollectorAddr is a mandatory parameter. We provide an example
value for this parameter in the following snippet.
- If you have deployed the
go-ipfix collector,
then please use the address:
<Ipfix-Collector Cluster IP>:<port>:<tcp|udp> - If you have deployed the
ELK
flow collector, then please use the address:
<Logstash Cluster IP>:4739:<tcp|udp>for sending IPFIX messages, or<Logstash Cluster IP>:4736:<tcp|udp>for sending JSON format records. Record format is specified withrecordFormat(defaults to IPFIX) and must match the format expected by the collector.
flow-aggregator.conf: |
  # Provide the flow collector address as a string with format <IP>:<port>[:<proto>], where proto is tcp or udp.
  # If no L4 transport proto is given, we consider tcp as default.
  externalFlowCollectorAddr: "192.168.86.86:4739:tcp"

  # Provide flow export interval as a duration string. This determines how often the flow aggregator exports flow
  # records to the flow collector.
  # Flow export interval should be greater than or equal to 1s (one second).
  # Valid time units are "ns", "us" (or "µs"), "ms", "s", "m", "h".
  #flowExportInterval: 60s

  # Provide the transport protocol for the flow aggregator collecting process, which is tls, tcp or udp.
  #aggregatorTransportProtocol: "tls"

  # Provide DNS name or IP address of flow aggregator for generating TLS certificate. It must match
  # the flowCollectorAddr parameter in the antrea-agent config.
  #flowAggregatorAddress: "flow-aggregator.flow-aggregator.svc"

  # Provide format for records sent to the configured flow collector.
  # Supported formats are IPFIX and JSON.
  #recordFormat: "IPFIX"

  # recordContents enables configuring some fields in the flow records. Fields can
  # be excluded to reduce record size, but some features or external tooling may
  # depend on these fields.
  recordContents:
    # Determine whether source and destination Pod labels will be included in the flow records.
    #podLabels: false

  # apiServer contains APIServer related configuration options.
  apiServer:
    # The port for the flow-aggregator APIServer to serve on.
    #apiPort: 10348

    # Comma-separated list of Cipher Suites. If omitted, the default Go Cipher Suites will be used.
    # https://golang.org/pkg/crypto/tls/#pkg-constants
    # Note that TLS1.3 Cipher Suites cannot be added to the list. But the apiserver will always
    # prefer TLS1.3 Cipher Suites whenever possible.
    #tlsCipherSuites:

    # TLS min version from: VersionTLS10, VersionTLS11, VersionTLS12, VersionTLS13.
    #tlsMinVersion:
Please note that the default values for flowExportInterval, aggregatorTransportProtocol,
and flowAggregatorAddress parameters are set to 60s, tls and flow-aggregator.flow-aggregator.svc,
respectively. Please make sure that aggregatorTransportProtocol and protocol of flowCollectorAddr in
agent-agent.conf are set to tls to guarantee secure communication works properly. Protocol of
flowCollectorAddr and aggregatorTransportProtocol must always match, so TLS must either be enabled for
both sides or disabled for both sides. Please modify the parameters as per your requirements.
Please note that the default value for podLabels is false, which
indicates source and destination Pod labels will not be included in the flow
records. If you would like to include them, you can modify the value to true.
Please note that the default value for apiPort is 10348, which is the port
used to expose the Flow Aggregator’s APIServer. Please modify the parameters as
per your requirements.
IPFIX Information Elements (IEs) in an Aggregated Flow Record
In addition to IPFIX information elements provided in the above section, the Flow Aggregator adds the following fields to the flow records.
IEs from Antrea IE Registry
| IPFIX Information Element | Field ID | Type | Description |
|---|---|---|---|
| packetTotalCountFromSourceNode | 120 | unsigned64 | The cumulative number of packets for this flow as reported by the source Node, since the flow started. |
| octetTotalCountFromSourceNode | 121 | unsigned64 | The cumulative number of octets for this flow as reported by the source Node, since the flow started. |
| packetDeltaCountFromSourceNode | 122 | unsigned64 | The number of packets for this flow as reported by the source Node, since the previous report for this flow at the observation point. |
| octetDeltaCountFromSourceNode | 123 | unsigned64 | The number of octets for this flow as reported by the source Node, since the previous report for this flow at the observation point. |
| reversePacketTotalCountFromSourceNode | 124 | unsigned64 | The cumulative number of reverse packets for this flow as reported by the source Node, since the flow started. |
| reverseOctetTotalCountFromSourceNode | 125 | unsigned64 | The cumulative number of reverse octets for this flow as reported by the source Node, since the flow started. |
| reversePacketDeltaCountFromSourceNode | 126 | unsigned64 | The number of reverse packets for this flow as reported by the source Node, since the previous report for this flow at the observation point. |
| reverseOctetDeltaCountFromSourceNode | 127 | unsigned64 | The number of reverse octets for this flow as reported by the source Node, since the previous report for this flow at the observation point. |
| packetTotalCountFromDestinationNode | 128 | unsigned64 | The cumulative number of packets for this flow as reported by the destination Node, since the flow started. |
| octetTotalCountFromDestinationNode | 129 | unsigned64 | The cumulative number of octets for this flow as reported by the destination Node, since the flow started. |
| packetDeltaCountFromDestinationNode | 130 | unsigned64 | The number of packets for this flow as reported by the destination Node, since the previous report for this flow at the observation point. |
| octetDeltaCountFromDestinationNode | 131 | unsigned64 | The number of octets for this flow as reported by the destination Node, since the previous report for this flow at the observation point. |
| reversePacketTotalCountFromDestinationNode | 132 | unsigned64 | The cumulative number of reverse packets for this flow as reported by the destination Node, since the flow started. |
| reverseOctetTotalCountFromDestinationNode | 133 | unsigned64 | The cumulative number of reverse octets for this flow as reported by the destination Node, since the flow started. |
| reversePacketDeltaCountFromDestinationNode | 134 | unsigned64 | The number of reverse packets for this flow as reported by the destination Node, since the previous report for this flow at the observation point. |
| reverseOctetDeltaCountFromDestinationNode | 135 | unsigned64 | The number of reverse octets for this flow as reported by the destination Node, since the previous report for this flow at the observation point. |
| sourcePodLabels | 143 | string | |
| destinationPodLabels | 144 | string | |
| throughput | 145 | unsigned64 | The average amount of traffic flowing from source to destination, since the previous report for this flow at the observation point. The unit is bits per second. |
| reverseThroughput | 146 | unsigned64 | The average amount of reverse traffic flowing from destination to source, since the previous report for this flow at the observation point. The unit is bits per second. |
| throughputFromSourceNode | 147 | unsigned64 | The average amount of traffic flowing from source to destination, since the previous report for this flow at the observation point, based on the records sent from the source Node. The unit is bits per second. |
| throughputFromDestinationNode | 148 | unsigned64 | The average amount of traffic flowing from source to destination, since the previous report for this flow at the observation point, based on the records sent from the destination Node. The unit is bits per second. |
| reverseThroughputFromSourceNode | 149 | unsigned64 | The average amount of reverse traffic flowing from destination to source, since the previous report for this flow at the observation point, based on the records sent from the source Node. The unit is bits per second. |
| reverseThroughputFromDestinationNode | 150 | unsigned64 | The average amount of reverse traffic flowing from destination to source, since the previous report for this flow at the observation point, based on the records sent from the destination Node. The unit is bits per second. |
| flowEndSecondsFromSourceNode | 151 | unsigned32 | The absolute timestamp of the last packet of this flow, based on the records sent from the source Node. The unit is seconds. |
| flowEndSecondsFromDestinationNode | 152 | unsigned32 | The absolute timestamp of the last packet of this flow, based on the records sent from the destination Node. The unit is seconds. |
Supported capabilities
Storage of Flow Records
Flow Aggregator stores the received flow records from Antrea Agents in a hash map, where the flow key is 5-tuple of a network connection. 5-tuple consists of Source IP, Destination IP, Source Port, Destination Port and Transport protocol. Therefore, Flow Aggregator maintains one flow record for any given connection, and this flow record gets updated till the connection in the Kubernetes cluster becomes invalid.
Correlation of Flow Records
In the case of inter-Node flows, there are two flow records, one from the source Node, where the flow originates from, and another one from the destination Node, where the destination Pod resides. Both the flow records contain incomplete information as mentioned here. Flow Aggregator provides support for the correlation of the flow records from the source Node and the destination Node, and it exports a single flow record with complete information for both inter-Node and intra-Node flows.
Aggregation of Flow Records
Flow Aggregator aggregates the flow records that belong to a single connection. As part of aggregation, fields such as flow timestamps, flow statistics etc. are updated. For the purpose of updating flow statistics fields, Flow Aggregator introduces the new fields in Antrea Enterprise IPFIX registry corresponding to the Source Node and Destination Node, so that flow statistics from different Nodes can be preserved.
Antctl support
antctl can access the Flow Aggregator API to dump flow records and print metrics about flow record processing. Refer to the antctl documentation for more information.
Quick deployment
If you would like to quickly try Network Flow Visibility feature, you can deploy Antrea, the Flow Aggregator Service and the ELK Flow Collector on the Vagrant setup. You can use the following command:
./infra/vagrant/provision.sh
./infra/vagrant/push_antrea.sh --flow-collector ELK
If you would like to deploy elastic search with high resources, you can change
the ES_JAVA_OPTS in the
ELK Flow Collector configuration
according to the
guide.
A larger heap size, like -Xms1g -Xmx2g, requires the Vagrant Nodes to have
higher memory than default. In this case, we need to provision the Nodes with
the --large option as with the following command:
./infra/vagrant/provision.sh --large
./infra/vagrant/push_antrea.sh --flow-collector ELK
Alternatively, given any external IPFIX flow collector, you can deploy Antrea and the Flow Aggregator Service on a default Vagrant setup by running the following commands:
./infra/vagrant/provision.sh
./infra/vagrant/push_antrea.sh --flow-collector <externalFlowCollectorAddress>
Flow Collectors
Here we list two choices the external configured flow collector: go-ipfix collector and ELK flow collector. For each collector, we introduce how to deploy it and how to output or visualize the collected flow records information.
Go-ipfix Collector
Deployment Steps
The go-ipfix collector can be built from go-ipfix library. It is used to collect, decode and log the IPFIX records.
- To deploy a released version of the go-ipfix collector, please choose one
deployment manifest from the list of releases (supported after v0.5.2).
For any given release
(e.g. v0.5.2), you can deploy the collector as follows:
kubectl apply -f https://github.com/vmware/go-ipfix/releases/download/<TAG>/ipfix-collector.yaml
- To deploy the latest version of the go-ipfix collector (built from the main branch), use the checked-in deployment manifest:
kubectl apply -f https://raw.githubusercontent.com/vmware/go-ipfix/main/build/yamls/ipfix-collector.yaml
Go-ipfix collector also supports customization on its parameters: port and protocol. Please follow the go-ipfix documentation to configure those parameters if needed.
Output Flow Records
To output the flow records collected by the go-ipfix collector, use the command below:
kubectl logs <ipfix-collector-pod-name> -n ipfix
ELK Flow Collector
Purpose
Antrea supports sending IPFIX flow records through the Flow Exporter feature described above. The Elastic Stack (ELK Stack) works as the data collector, data storage and visualization tool for flow records and flow-related information. This document provides the guidelines for deploying Elastic Stack with support for Antrea-specific IPFIX fields in a Kubernetes cluster.
About Elastic Stack
Elastic Stack is a group of open source products to help collect, store, search, analyze and visualize data in real time. We will use Logstash, Elasticsearch and Kibana in Antrea flow visualization. Logstash works as data collector to centralize flow records. Logstash Netflow codec plugin supports Netflow v5/v9/v10(IPFIX) protocols for flow data collection. The flow exporter feature in Antrea Agent uses the IPFIX (Netflow v10) protocol to export flow records.
Elasticsearch, as a RESTful search engine, supports storing, searching and indexing records received. Kibana is mainly for data visualization and exploration.
Deployment Steps
If you are looking for steps to deploy the ELK flow collector along with a new Antrea cluster and the Flow Aggregator Service, then please refer to the quick deployment section.
The following steps will deploy the ELK flow collector on an existing Kubernetes
cluster, which uses Antrea as the CNI. First step is to fetch the necessary resources
from the Antrea repository. You can either clone the entire repo or download the
particular folder using the subversion(svn) utility. If the deployed version of
Antrea has a release <TAG> (e.g. v0.10.0), then you can use the following command:
git clone --depth 1 --branch <TAG> https://github.com/antrea-io/antrea.git && cd antrea/build/yamls/
or
svn export https://github.com/antrea-io/antrea/tags/<TAG>/build/yamls/elk-flow-collector/
If the deployed version of Antrea is the latest version, i.e., built from the main branch, then you can use the following command:
git clone --depth 1 --branch main https://github.com/antrea-io/antrea.git && cd antrea/build/yamls/
or
svn export https://github.com/antrea-io/antrea/trunk/build/yamls/elk-flow-collector/
To create the required K8s resources in the elk-flow-collector folder and get
everything up-and-running, run following commands:
kubectl create namespace elk-flow-collector
kubectl create configmap logstash-configmap -n elk-flow-collector --from-file=./elk-flow-collector/logstash/
kubectl apply -f ./elk-flow-collector/elk-flow-collector.yml -n elk-flow-collector
Please refer to the Flow Aggregator Configuration to configure external flow collector as Logstash Service Cluster IP.
Kibana dashboard is exposed as a Nodeport Service, which can be accessed via
http://[NodeIP]: 30007. elk-flow-collector/kibana.ndjson is an auto-generated
reusable file containing pre-built objects for visualizing Pod-to-Pod, Pod-to-Service
and Node-to-Node flow records. To import the dashboards into Kibana, go to
Management -> Saved Objects and import elk-flow-collector/kibana.ndjson.
Pre-built Dashboards
The following dashboards are pre-built and are recommended for Antrea flow visualization.
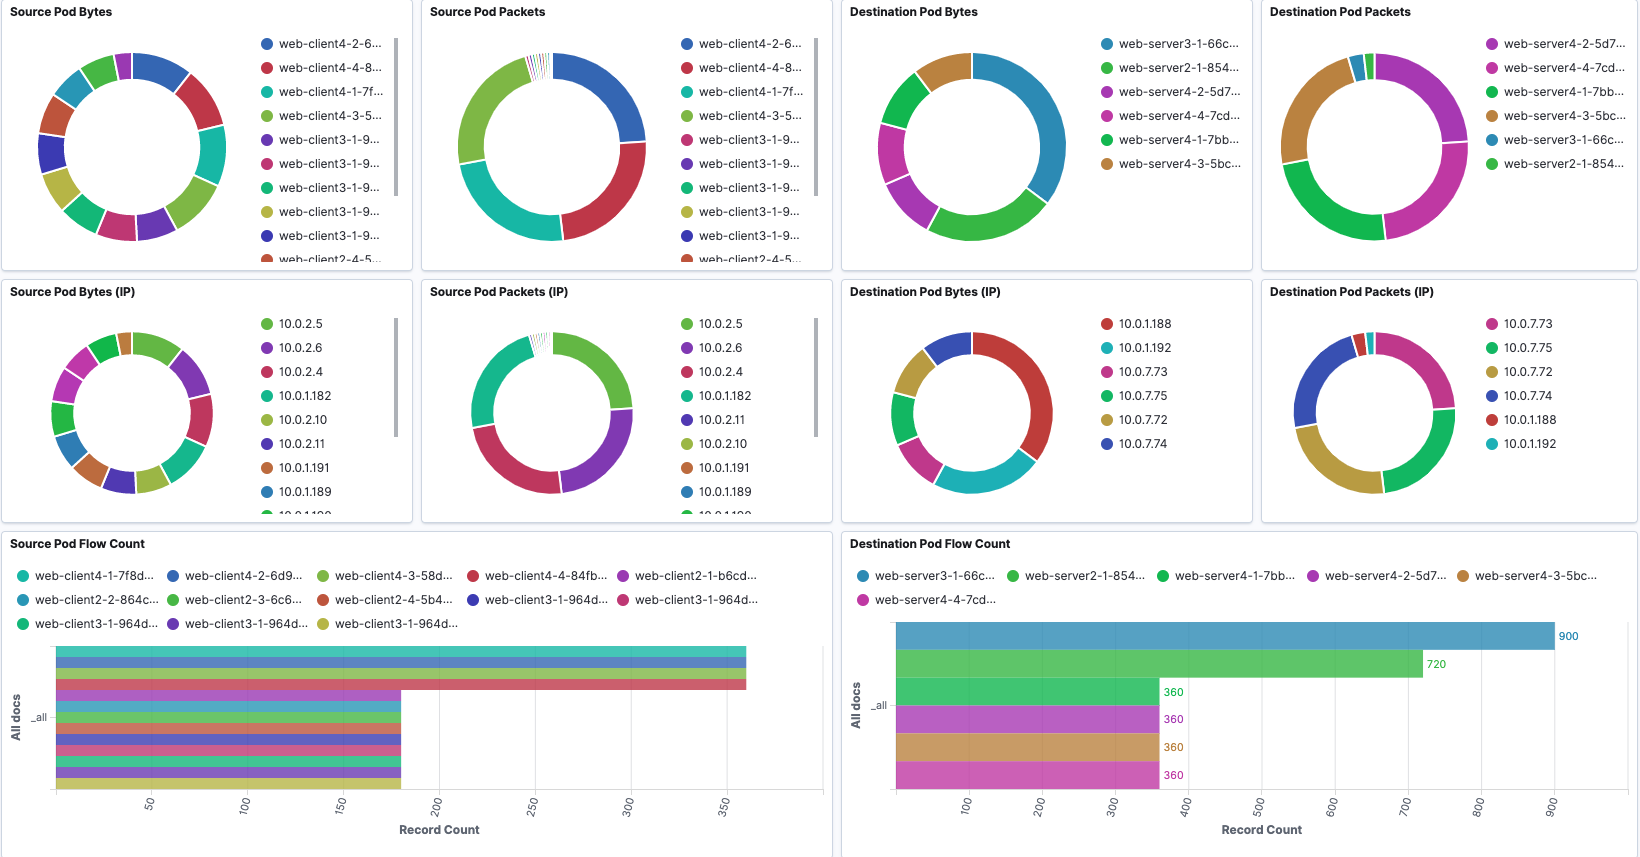
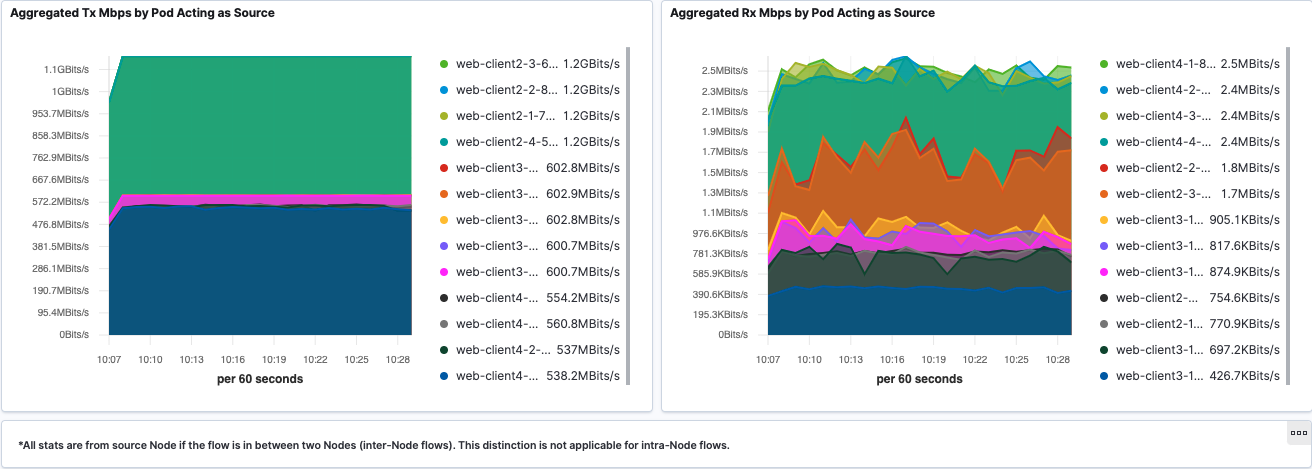
Overview
An overview of Pod-based flow records information is provided.
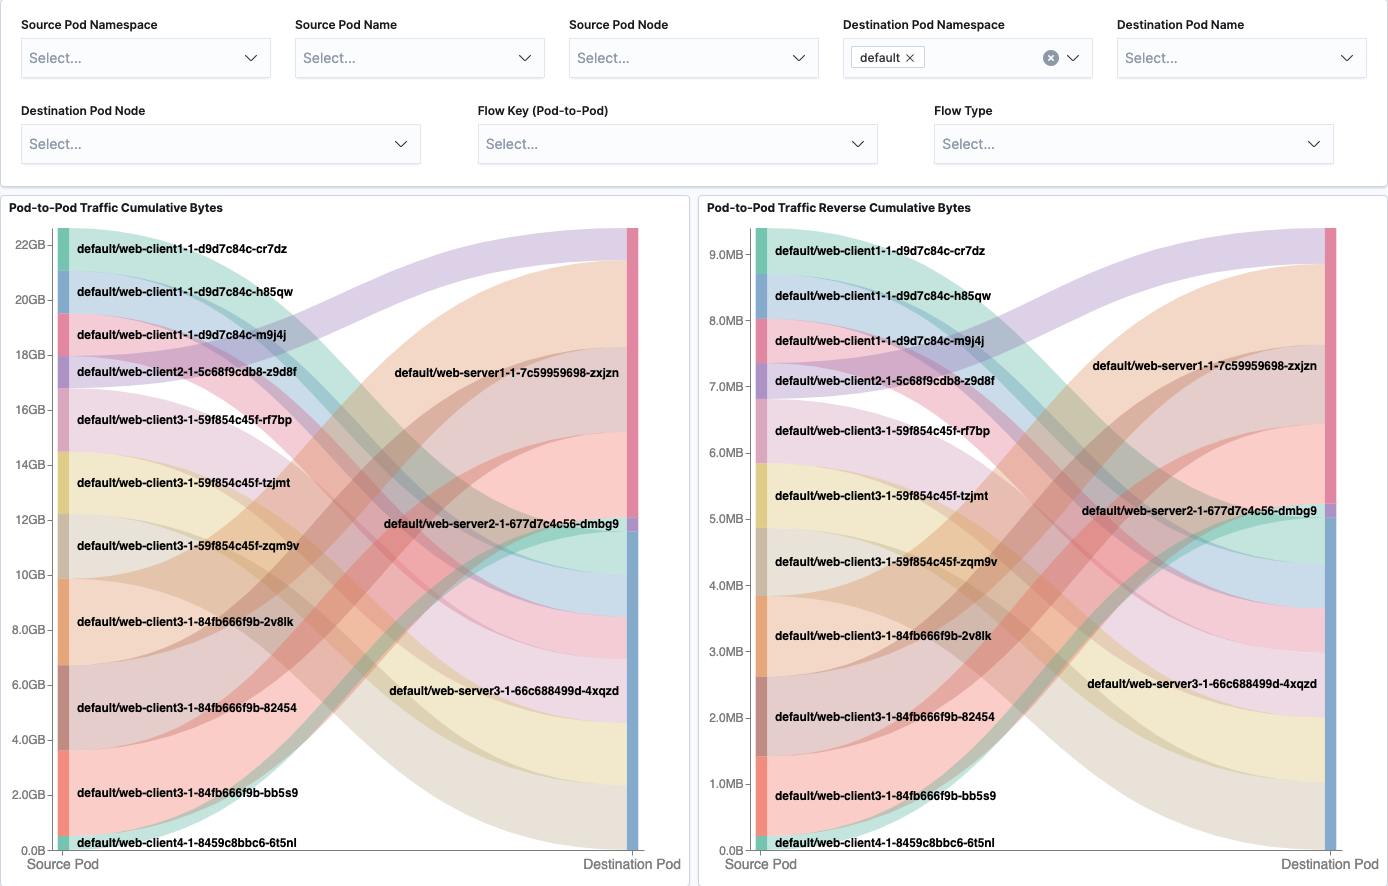
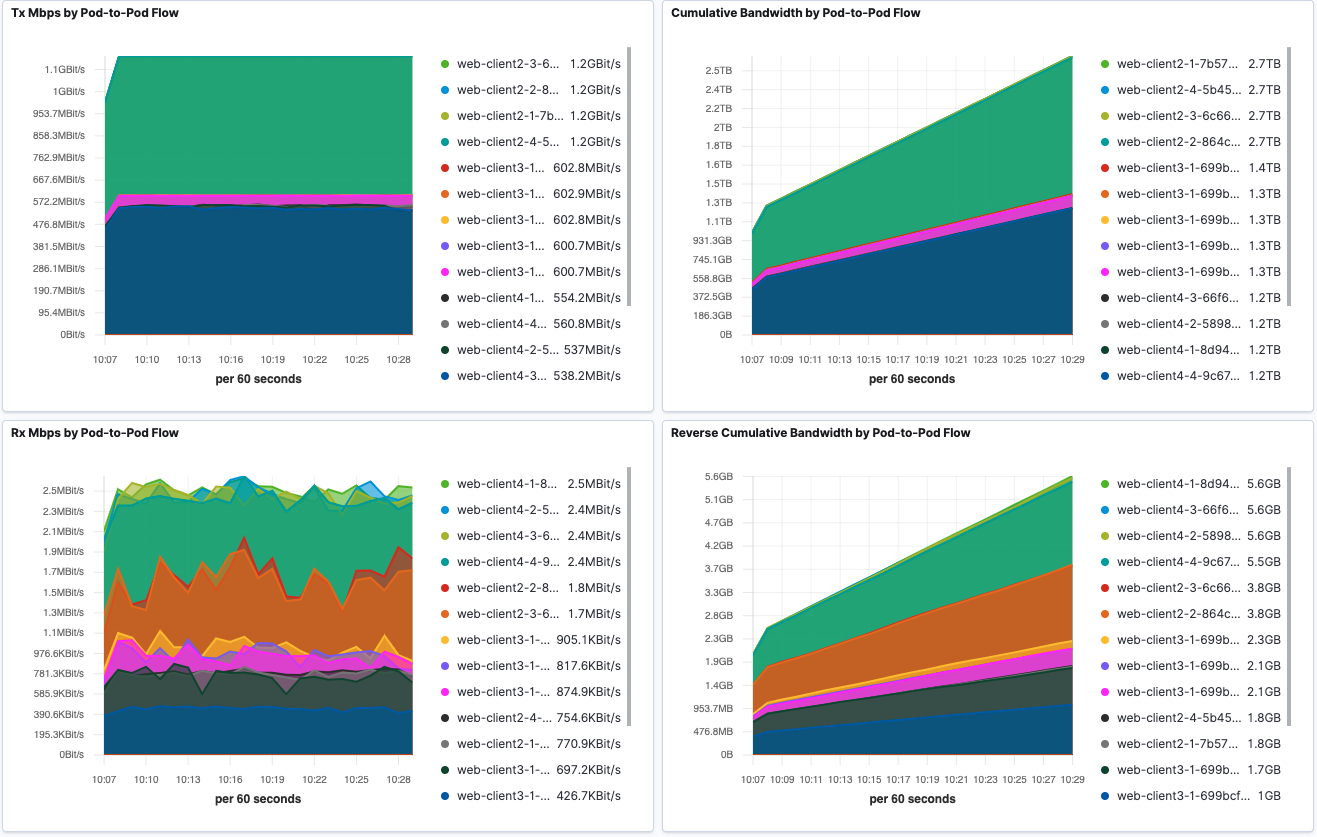
Pod-to-Pod Flows
Pod-to-Pod cumulative Tx and Rx traffic is shown in sankey diagrams. Corresponding source or destination Pod throughput is visualized using line graph.
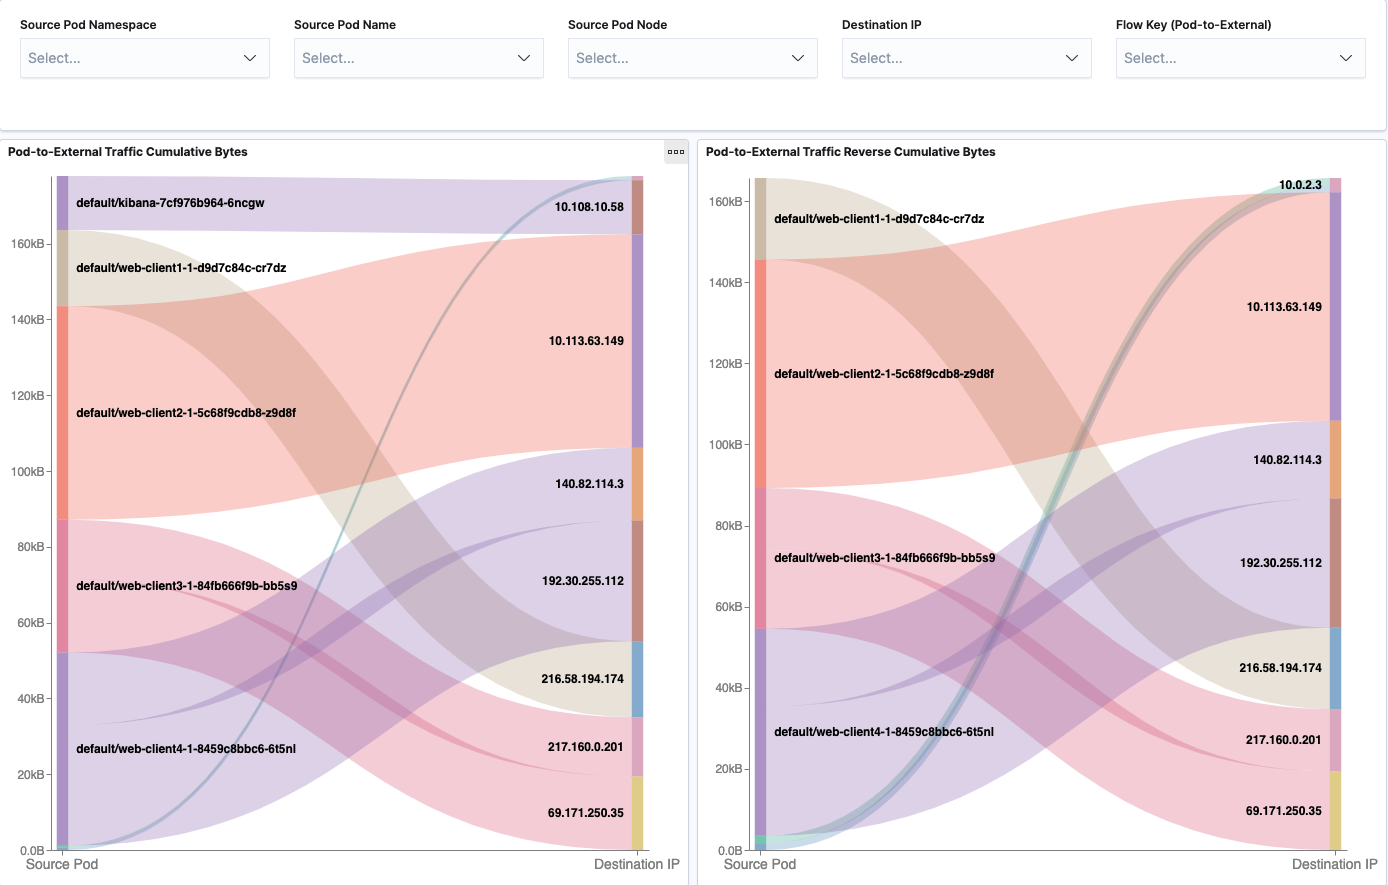
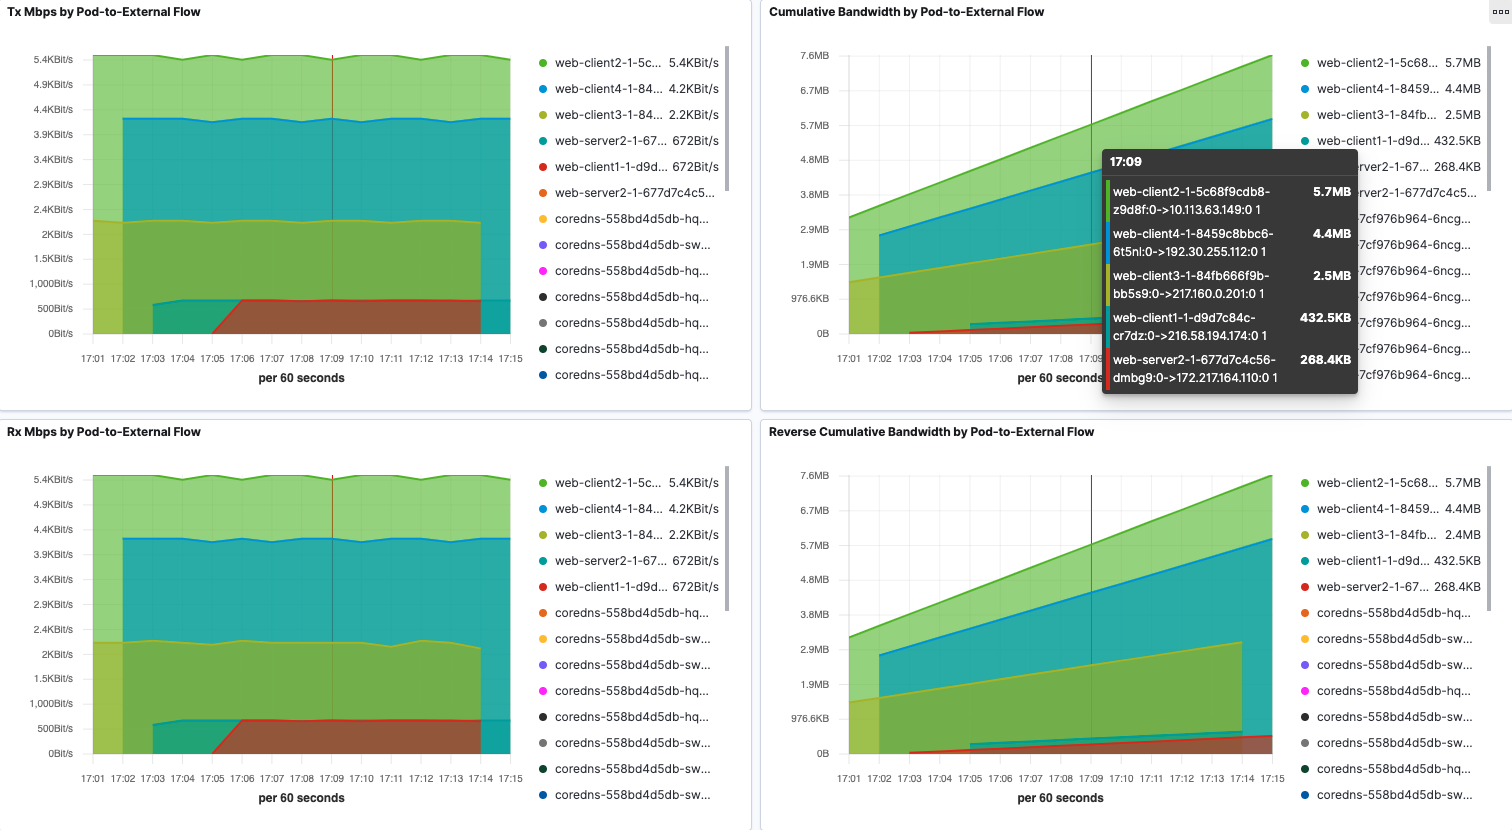
Pod-to-External Flows
Pod-to-External cumulative Tx and Rx traffic is shown in sankey diagrams. Corresponding source or destination throughput is visualized using line graph.
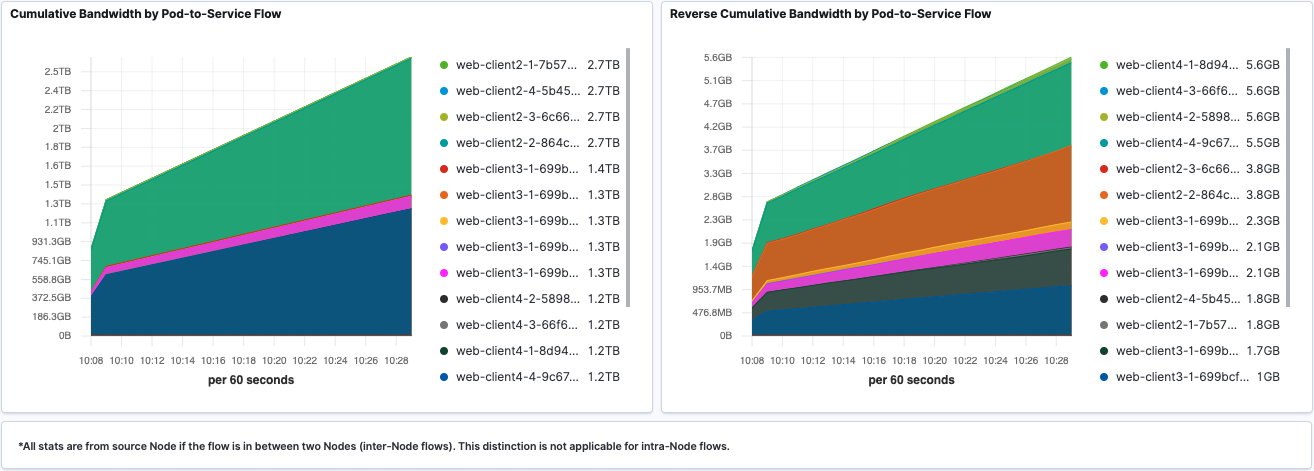
Pod-to-Service Flows
Pod-to-Service traffic is presented similar to Pod-to-Pod/External traffic. Corresponding source or destination IP addresses is shown in tooltips.
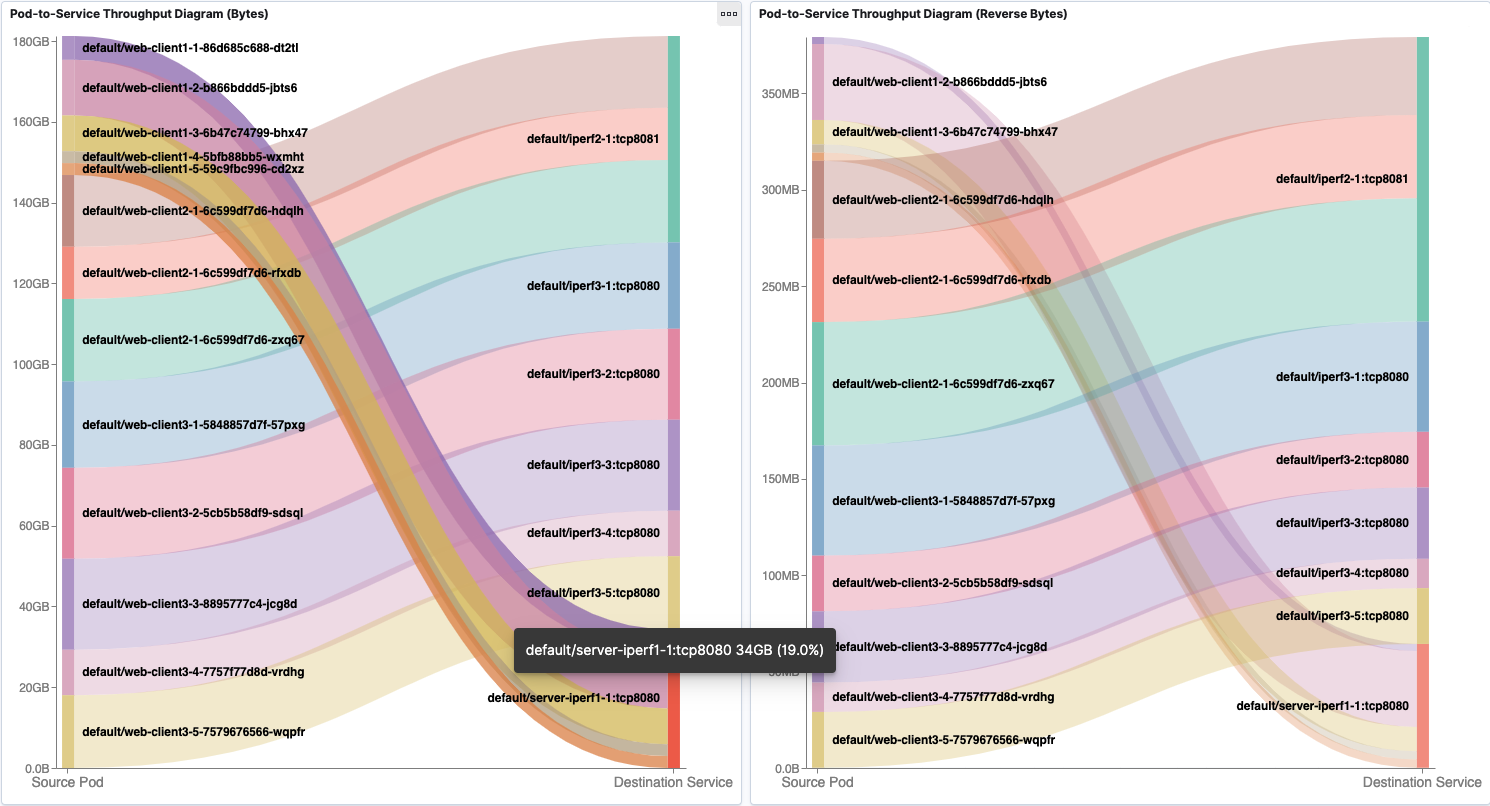
Aggregated Tx and Rx traffic based on destination Service is shown in line graph.

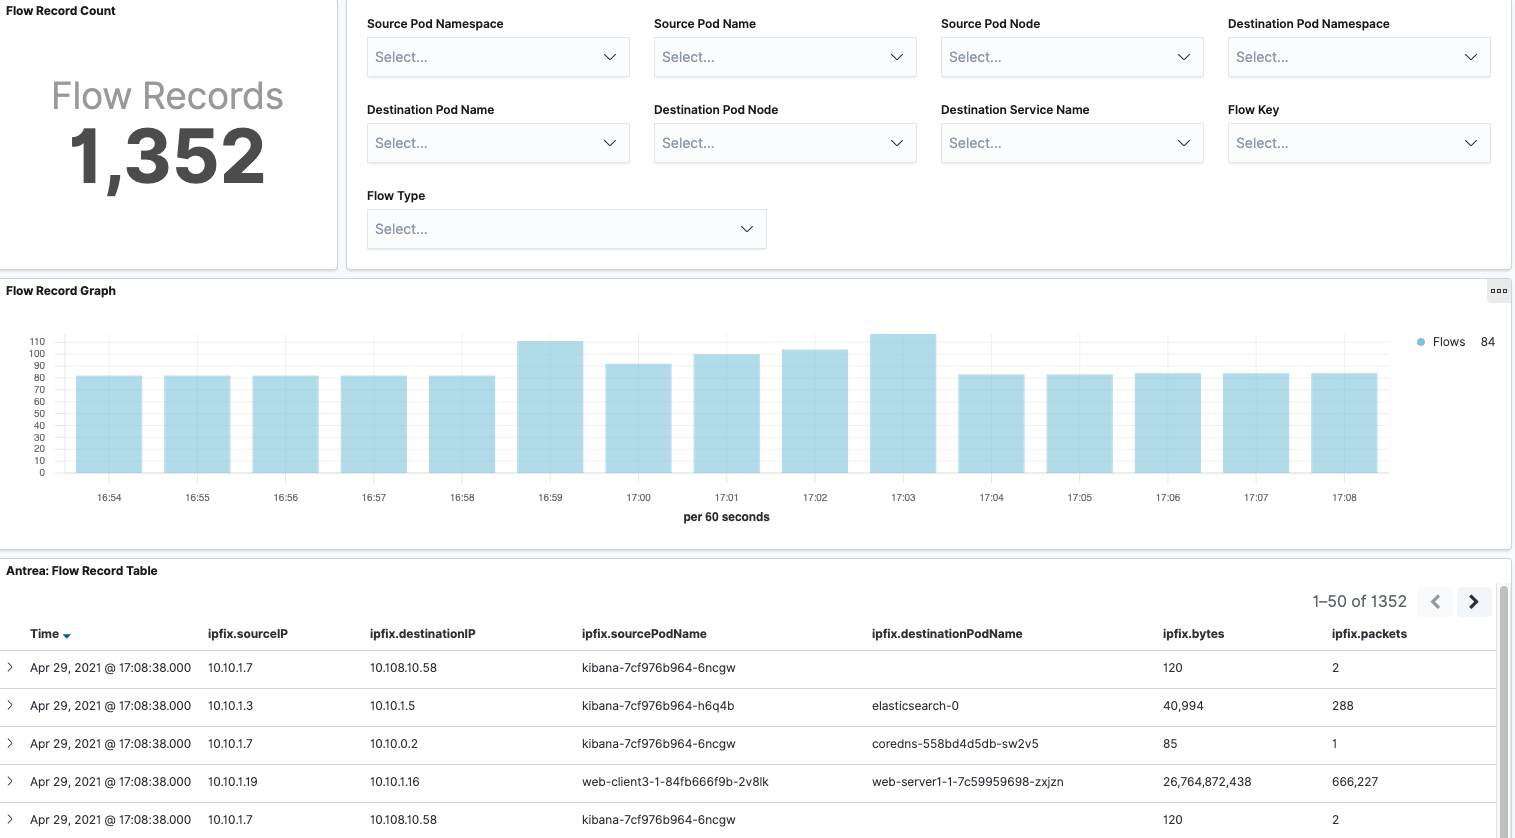
Flow Records
Flow Records dashboard shows the raw flow records over time with support for filters.
Node Throughput
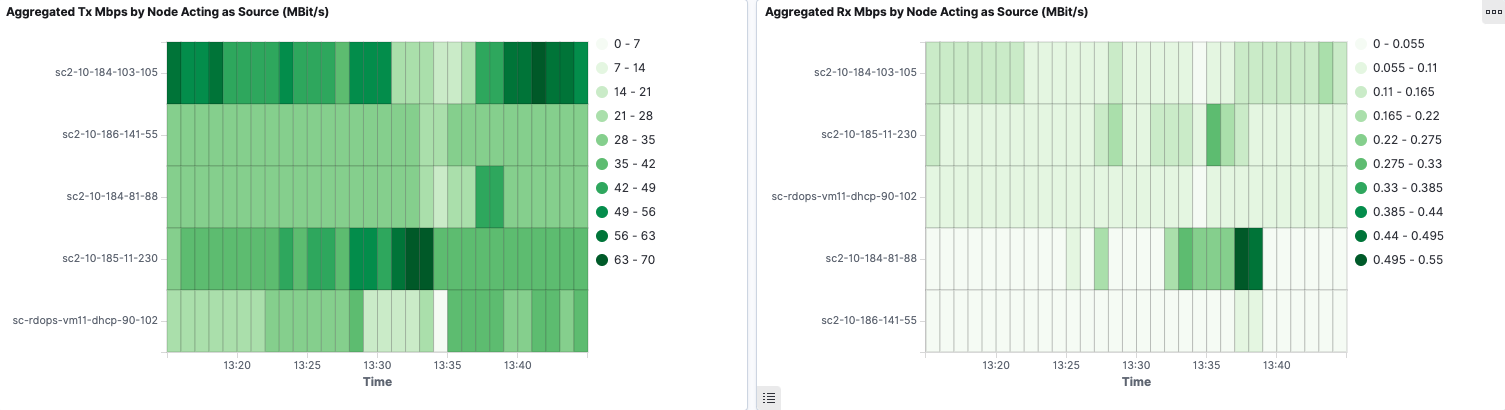
Node Throughput dashboard shows the visualization of inter-Node and intra-Node traffic by aggregating all the Pod traffic per Node.
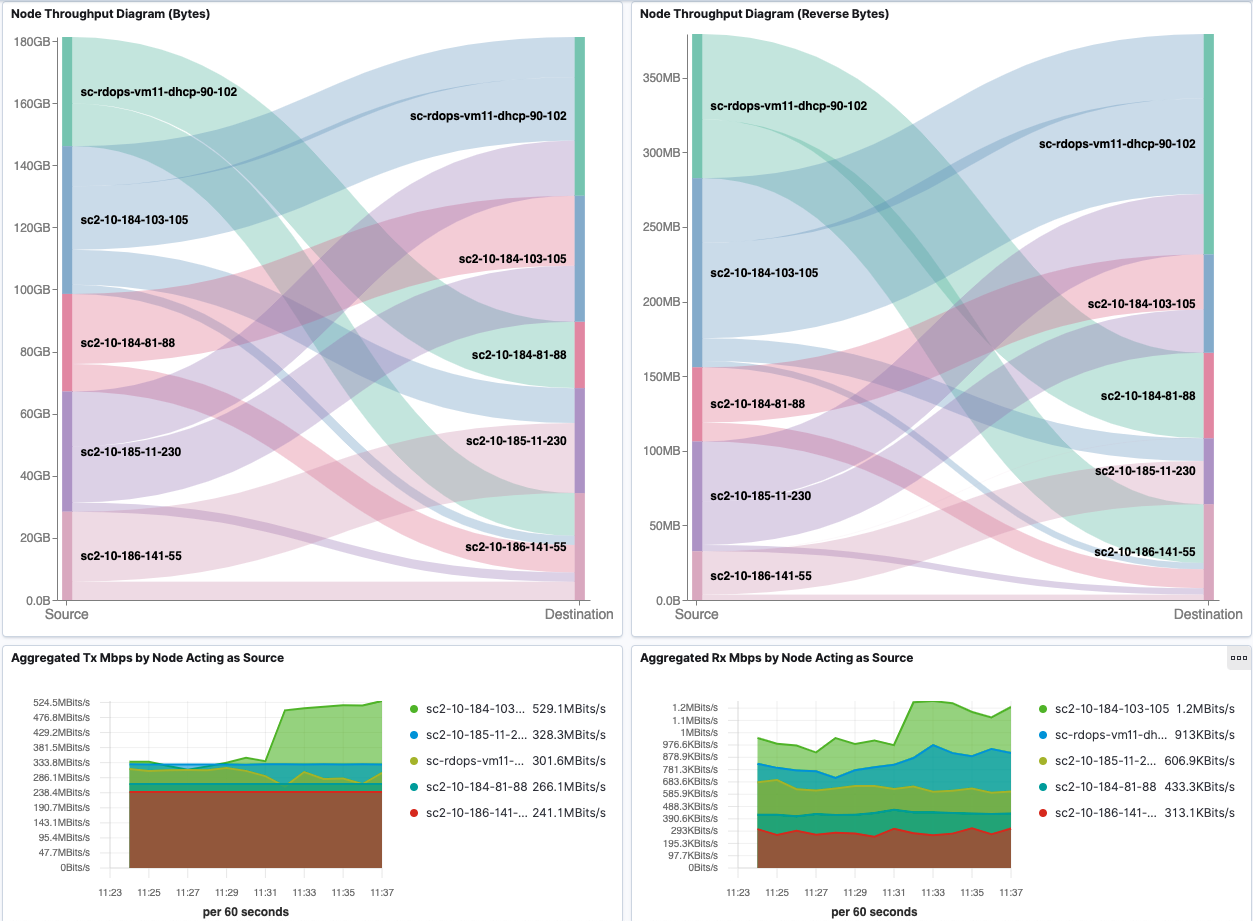
We also present aggregated Tx and Rx Mbps by Node in heatmap to give a better overview of Node bandwidth consumption.
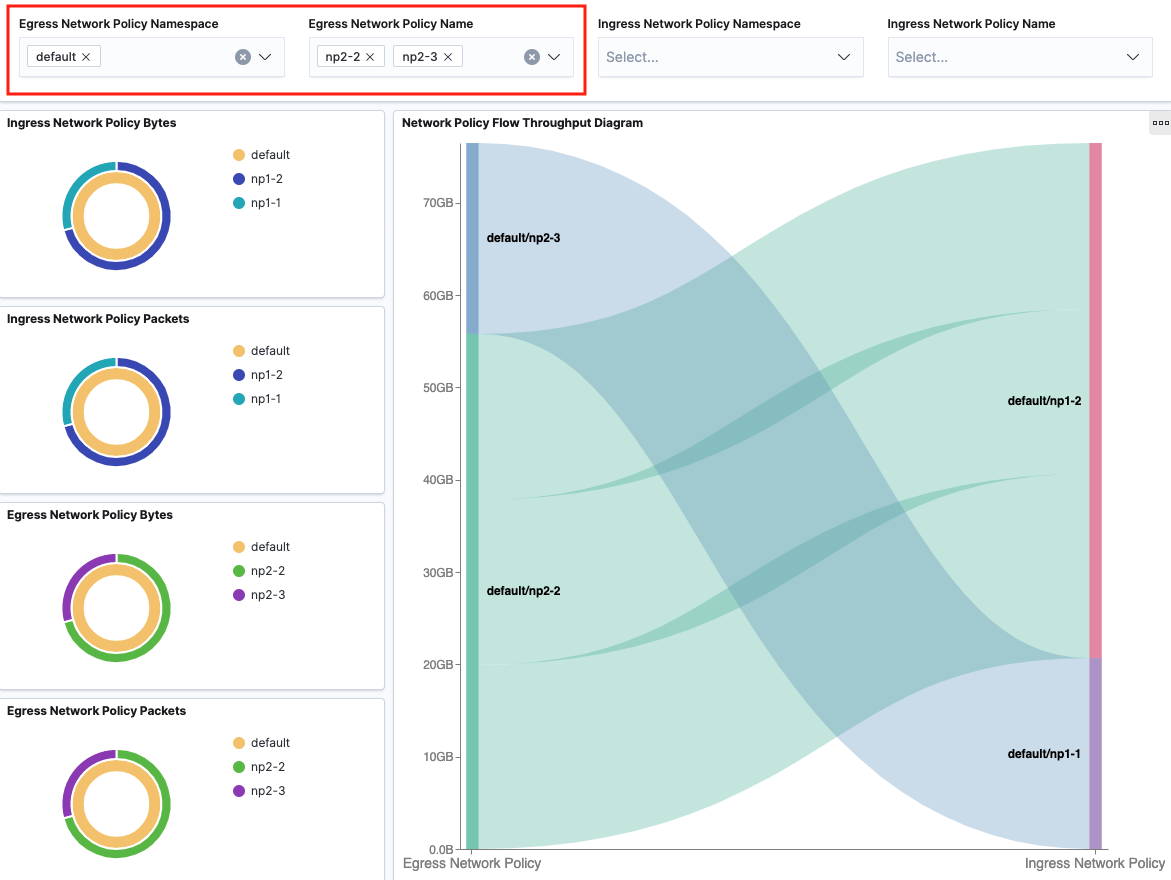
Network Policy
Network Policy dashboard provides filters over ingress network policy name and namespace, egress network policy name and namespace to view corresponding flow throughput under network policy. Flows are grouped by egress network policies (source) and ingress network policies (destination) in the sankey diagram. When hovering over the flow, it will show corresponding Pod-to-Pod traffic details and network policies.
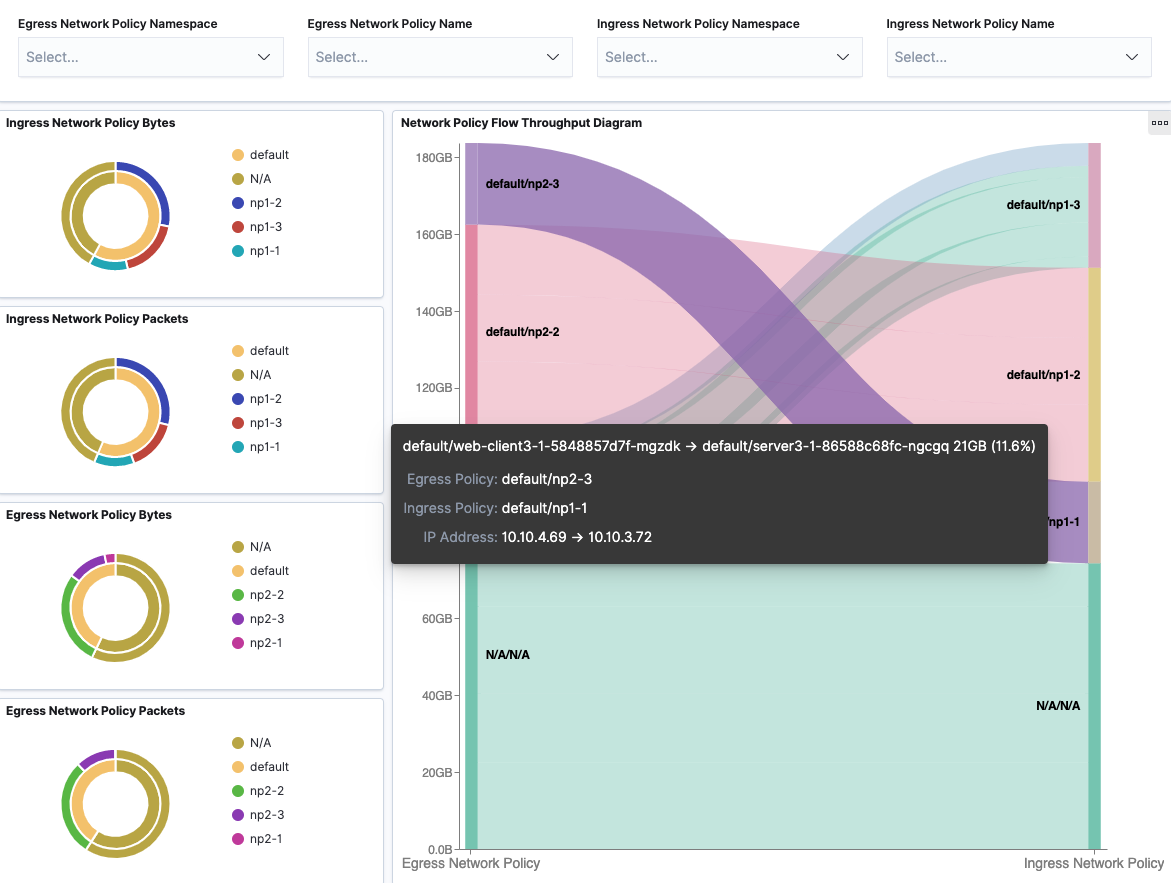
With filters applied: