Documentation
Introduction
Cloud Deployment
Reference
- Antrea Network Policy
- antctl
- Architecture
- Traffic Encryption (Ipsec / WireGuard)
- Securing Control Plane
- Troubleshooting
- OS-specific Known Issues
- OVS Pipeline
- Feature Gates
- Network Flow Visibility
- Traceflow Guide
- NoEncap and Hybrid Traffic Modes
- Egress Guide
- NodePortLocal Guide
- Versioning
- Antrea API Groups
- Antrea API Reference
Windows
Integrations
Cookbooks
Developer Guide
Project Information
Traceflow User Guide
Antrea supports using Traceflow for network diagnosis. It can inject a packet
into OVS on a Node and trace the forwarding path of the packet across Nodes,
and it can also trace a matched packet of real traffic from or to a Pod. In
either case, a Traceflow operation is triggered by a Traceflow CRD which
specifies the type of Traceflow, the source and destination of the packet to
trace, and the headers of the packet. And the Traceflow results will be
populated to the status field of the Traceflow CRD, which include the
observations of the trace packet at various observations points in the
forwarding path. Besides creating the Traceflow CRD using kubectl, users can
also start a Traceflow using antctl, or from the Antrea Octant Plugin. When
using the Antrea Octant plugin, the Traceflow results can be visualized using a
graph.
Table of Contents
Prerequisites
The Traceflow feature is enabled by default since Antrea version 0.11.0. If you are using an Antrea version before 0.11.0, you need to enable Traceflow from the featureGates map defined in antrea.yml for both Controller and Agent. In order to use a Service as the destination in traces, you also need to ensure AntreaProxy is enabled in the Agent configuration:
  antrea-controller.conf: |
    featureGates:
    # Enable traceflow which provides packet tracing feature to diagnose network issue.
      Traceflow: true
  antrea-agent.conf: |
    featureGates:
    # Enable traceflow which provides packet tracing feature to diagnose network issue.
      Traceflow: true
    # Enable AntreaProxy which provides ServiceLB for in-cluster Services in antrea-agent.
    # It should be enabled on Windows, otherwise NetworkPolicy will not take effect on
    # Service traffic.
      AntreaProxy: true
For antrea-octant-plugin installation, please refer to antrea-octant-installation.
Start a New Traceflow
You can choose to use kubectl together with a YAML file, the antctl traceflow
command, or the Octant UI to start a new trace.
When starting a new trace, you can provide the following information which will be used to build the trace packet:
- source Pod
- destination Pod, Service or destination IP address
- transport protocol (TCP/UDP/ICMP)
- transport ports
Using kubectl and YAML file (IPv4)
You can start a new trace by creating Traceflow CRD via kubectl and a YAML file which contains the essential configuration of Traceflow CRD. An example YAML file of Traceflow CRD might look like this:
apiVersion: crd.antrea.io/v1alpha1
kind: Traceflow
metadata:
  name: tf-test
spec:
  source:
    namespace: default
    pod: tcp-sts-0
  destination:
    namespace: default
    pod: tcp-sts-2
    # destination can also be an IP address ('ip' field) or a Service name ('service' field); the 3 choices are mutually exclusive.
  packet:
    ipHeader: # If ipHeader/ipv6Header is not set, the default value is IPv4+ICMP.
      protocol: 6 # Protocol here can be 6 (TCP), 17 (UDP) or 1 (ICMP), default value is 1 (ICMP)
    transportHeader:
      tcp:
        srcPort: 10000 # Source port needs to be set when Protocol is TCP/UDP.
        dstPort: 80 # Destination port needs to be set when Protocol is TCP/UDP.
The CRD above starts a new trace from port 10000 of source Pod named tcp-sts-0 to port 80
of destination Pod named tcp-sts-2 using TCP protocol.
Using kubectl and YAML file (IPv6)
Antrea Traceflow supports IPv6 traffic. An example YAML file of Traceflow CRD might look like this:
apiVersion: crd.antrea.io/v1alpha1
kind: Traceflow
metadata:
  name: tf-test-ipv6
spec:
  source:
    namespace: default
    pod: tcp-sts-0
  destination:
    namespace: default
    pod: tcp-sts-2
    # destination can also be an IPv6 address ('ip' field) or a Service name ('service' field); the 3 choices are mutually exclusive.
  packet:
    ipv6Header: # ipv6Header MUST be set to run Traceflow in IPv6, and ipHeader will be ignored when ipv6Header set.
      nextHeader: 58 # Protocol here can be 6 (TCP), 17 (UDP) or 58 (ICMPv6), default value is 58 (ICMPv6)
The CRD above starts a new trace from source Pod named tcp-sts-0 to destination Pod named tcp-sts-2 using ICMPv6
protocol.
Live-traffic Traceflow
Starting from Antrea version 1.0.0, you can trace a packet of the real traffic
from or to a Pod, instead of the injected packet. To start such a Traceflow, add
liveTraffic: true to the Traceflow spec. Then, the first packet of the first
connection that matches the Traceflow spec will be traced (connections opened
before the Traceflow was initiated will be ignored), and the headers of the
packet will be captured and reported in the status field of the Traceflow CRD,
in addition to the observations. A live-traffic Traceflow requires only one of
source and destination to be specified. When source or destination is
not specified, it means that a packet can be captured regardless of its source
or destination. One of source and destination must be a Pod. When source
is not specified, or is an IP address, only the receiver Node will capture the
packet and trace it after the L2 forwarding observation point. This means that
even if the source of the packet is on the same Node as the destination, no
observations on the sending path will be reported for the Traceflow. By default,
a live-traffic Traceflow (the same as a normal Traceflow) will timeout in 20
seconds, and if no matched packet captured before the timeout the Traceflow
will fail. But you can specify a different timeout value, by adding
timeout: <value-in-seconds> to the Traceflow spec.
In some cases, it might be useful to capture the packets dropped by
NetworkPolicies (inc. K8s NetworkPolicies or Antrea native policies). You can
add droppedOnly: true to the live-traffic Traceflow spec, then the first
packet that matches the Traceflow spec and is dropped by a NetworkPolicy will
be captured and traced.
The following example is a live-traffic Traceflow that captures a dropped UDP packet to UDP port 1234 of Pod udp-server, within 1 minute:
apiVersion: crd.antrea.io/v1alpha1
kind: Traceflow
metadata:
  name: tf-test
spec:
  liveTraffic: true
  droppedOnly: true
  destination:
    namespace: default
    pod: udp-server
  packet:
    transportHeader:
      udp:
        dstPort: 1234
  timeout: 60
Using antctl
Please refer to the corresponding antctl page.
Using Octant with antrea-octant-plugin
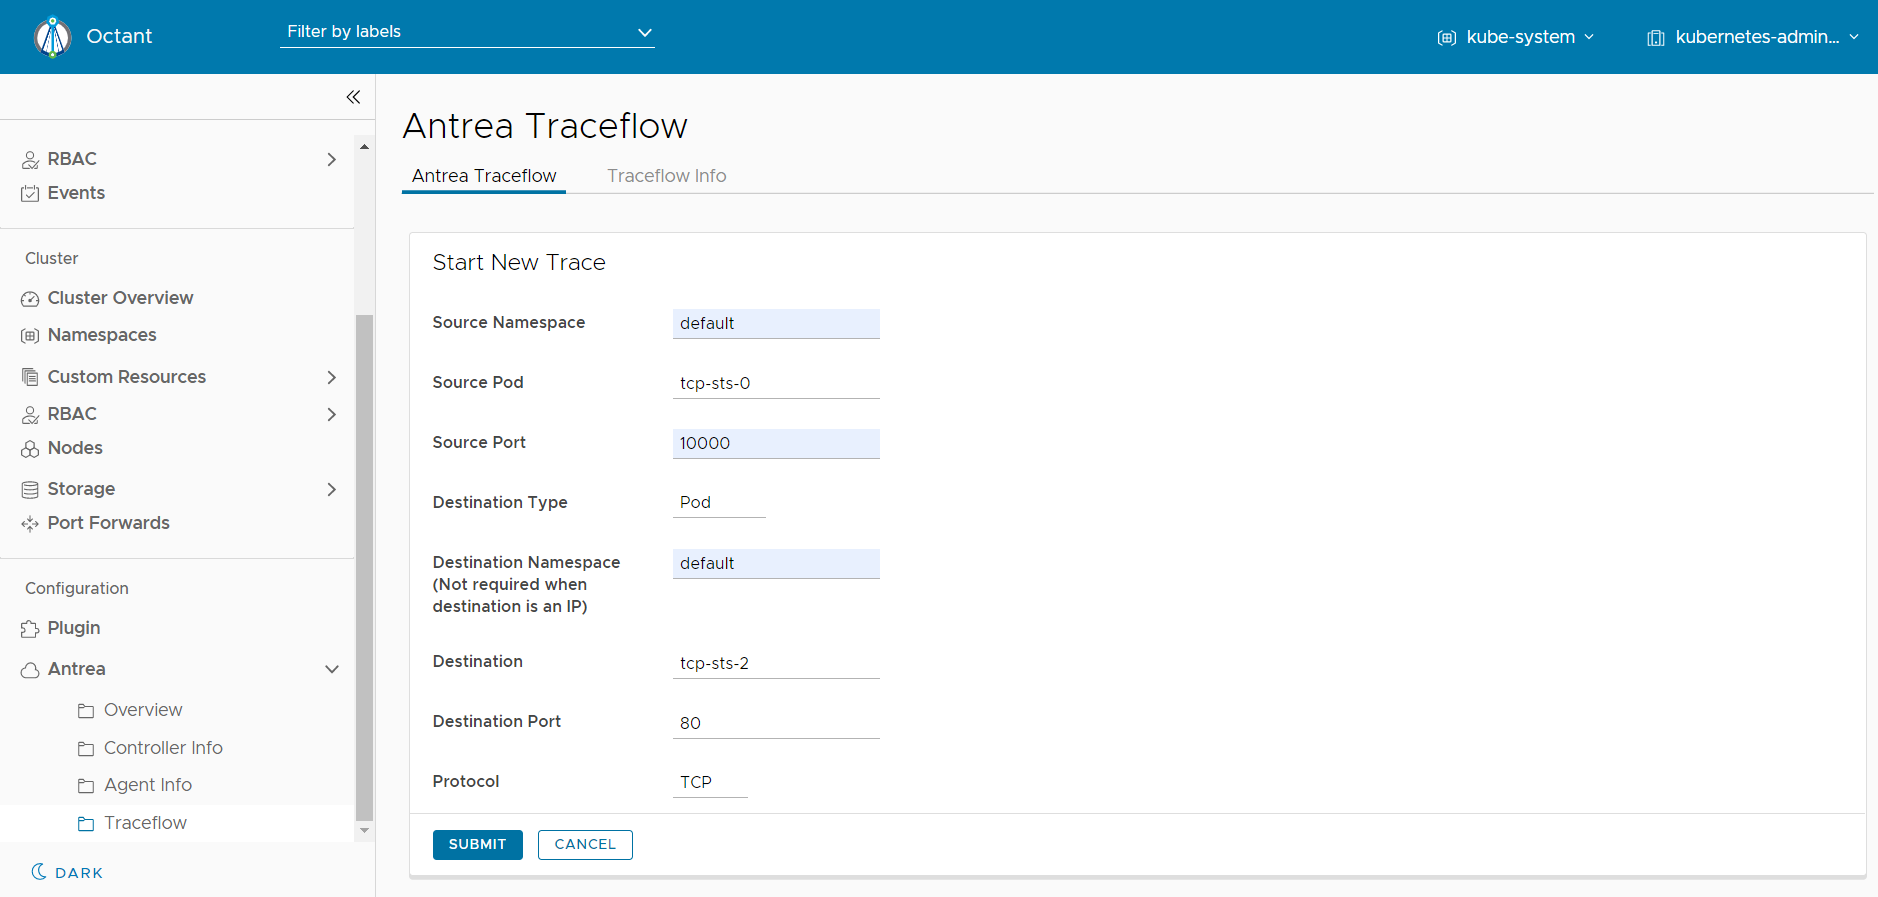
From Octant dashboard, you need to click on left navigation bar named “Antrea” and then choose category named “Traceflow” to lead you to the Traceflow UI displayed on the right side.
Now, you can start a new trace by clicking on the button named “Start New Trace” and submitting the form with trace details. It helps you create a Traceflow CRD and generates a corresponding Traceflow Graph.
View Traceflow Result and Graph
You can always view Traceflow result directly via Traceflow CRD status and see if the packet is successfully delivered or somehow dropped by certain packet-processing stage. Antrea also provides a more user-friendly way by showing the Traceflow result via a trace graph on UI.
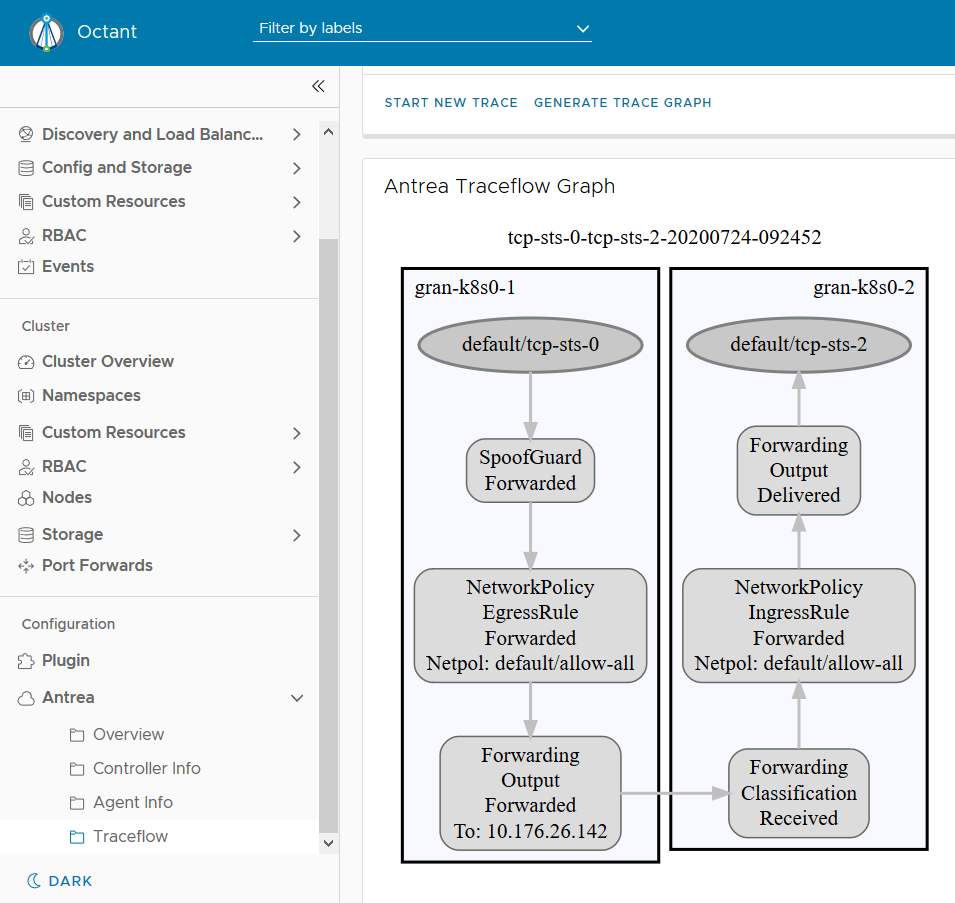
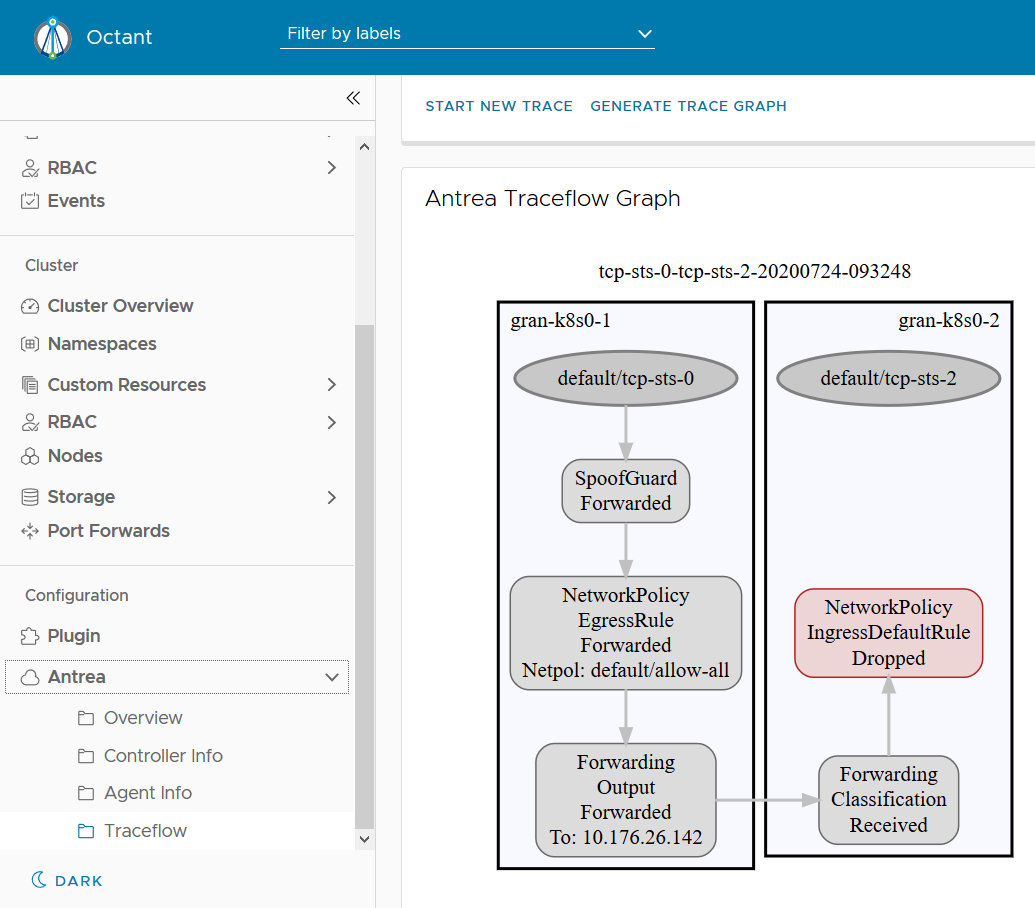
From the graph above, we can see the inter-node traffic between two Pods has been successfully delivered. Sometimes the traffic may not be successfully delivered and we can always easily identify where the traffic is dropped via a trace graph like below.
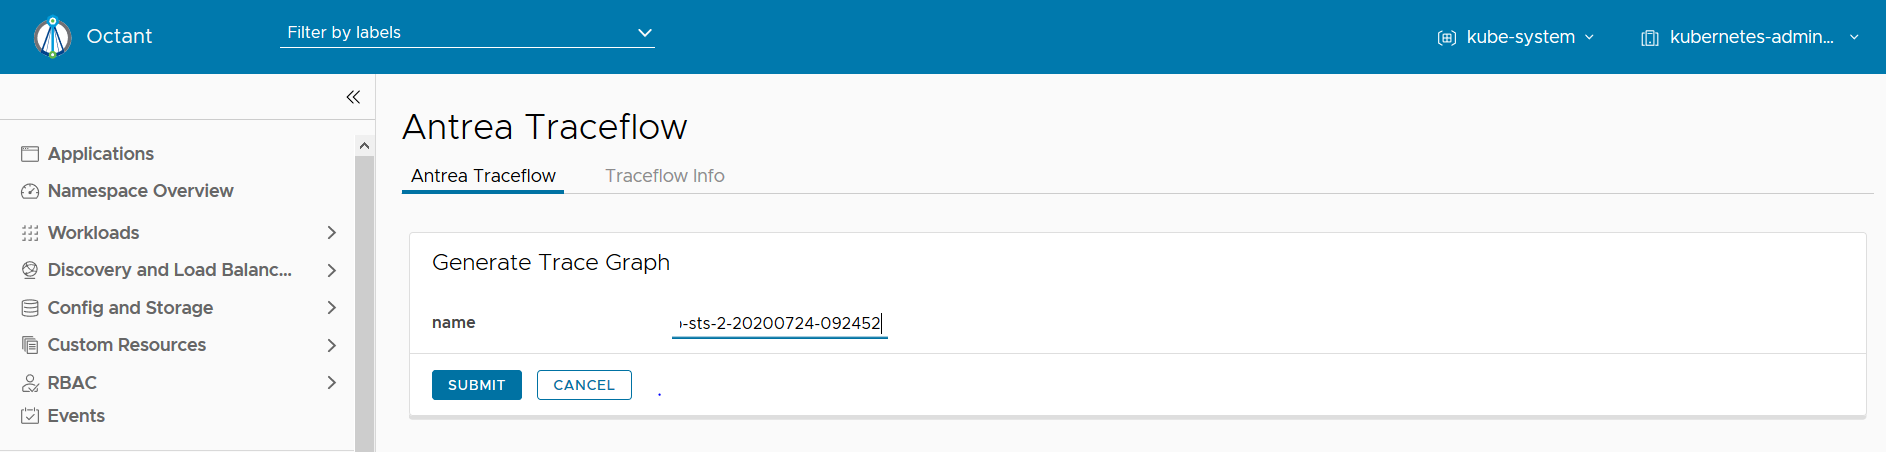
You can also generate a historical trace graph by providing a specific Traceflow CRD name (assuming the CRD has not been deleted yet) as shown below.
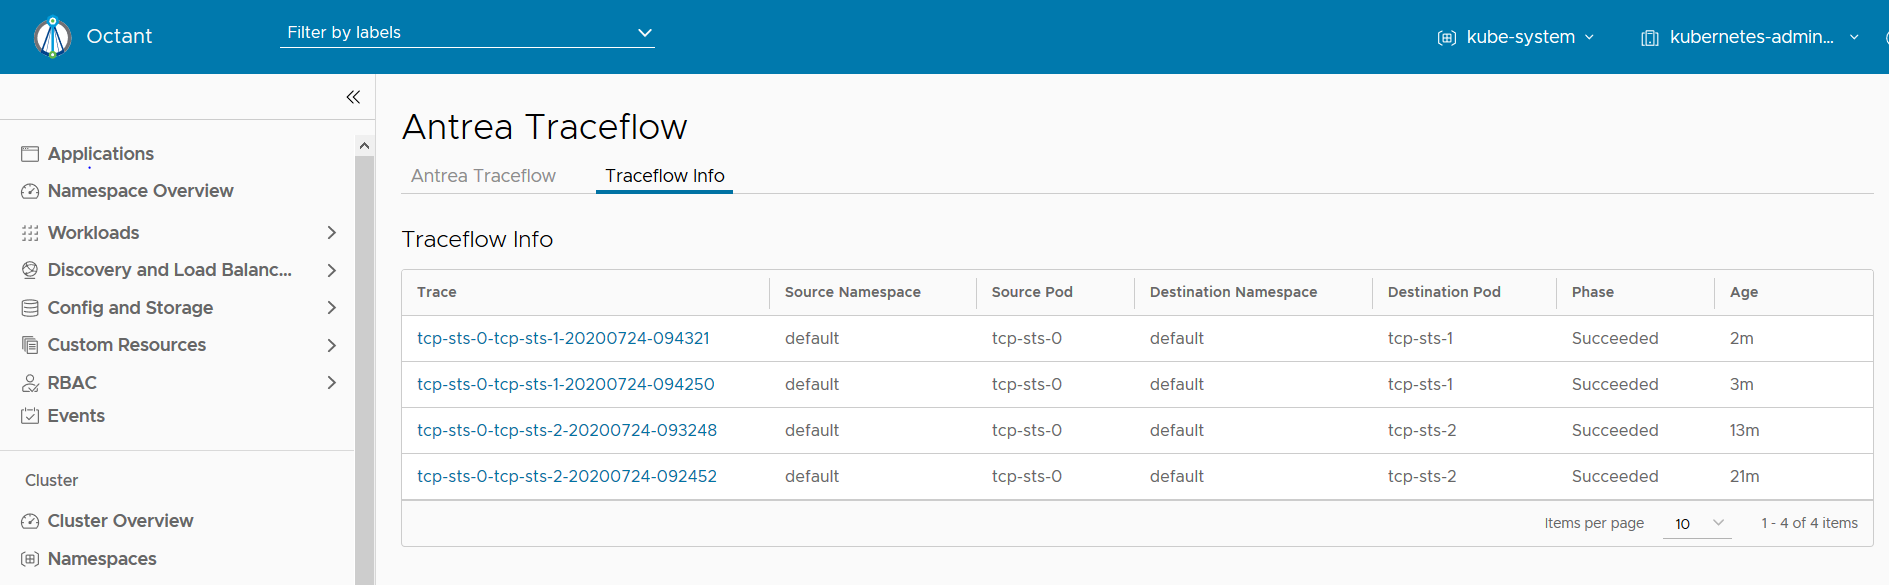
View Traceflow CRDs
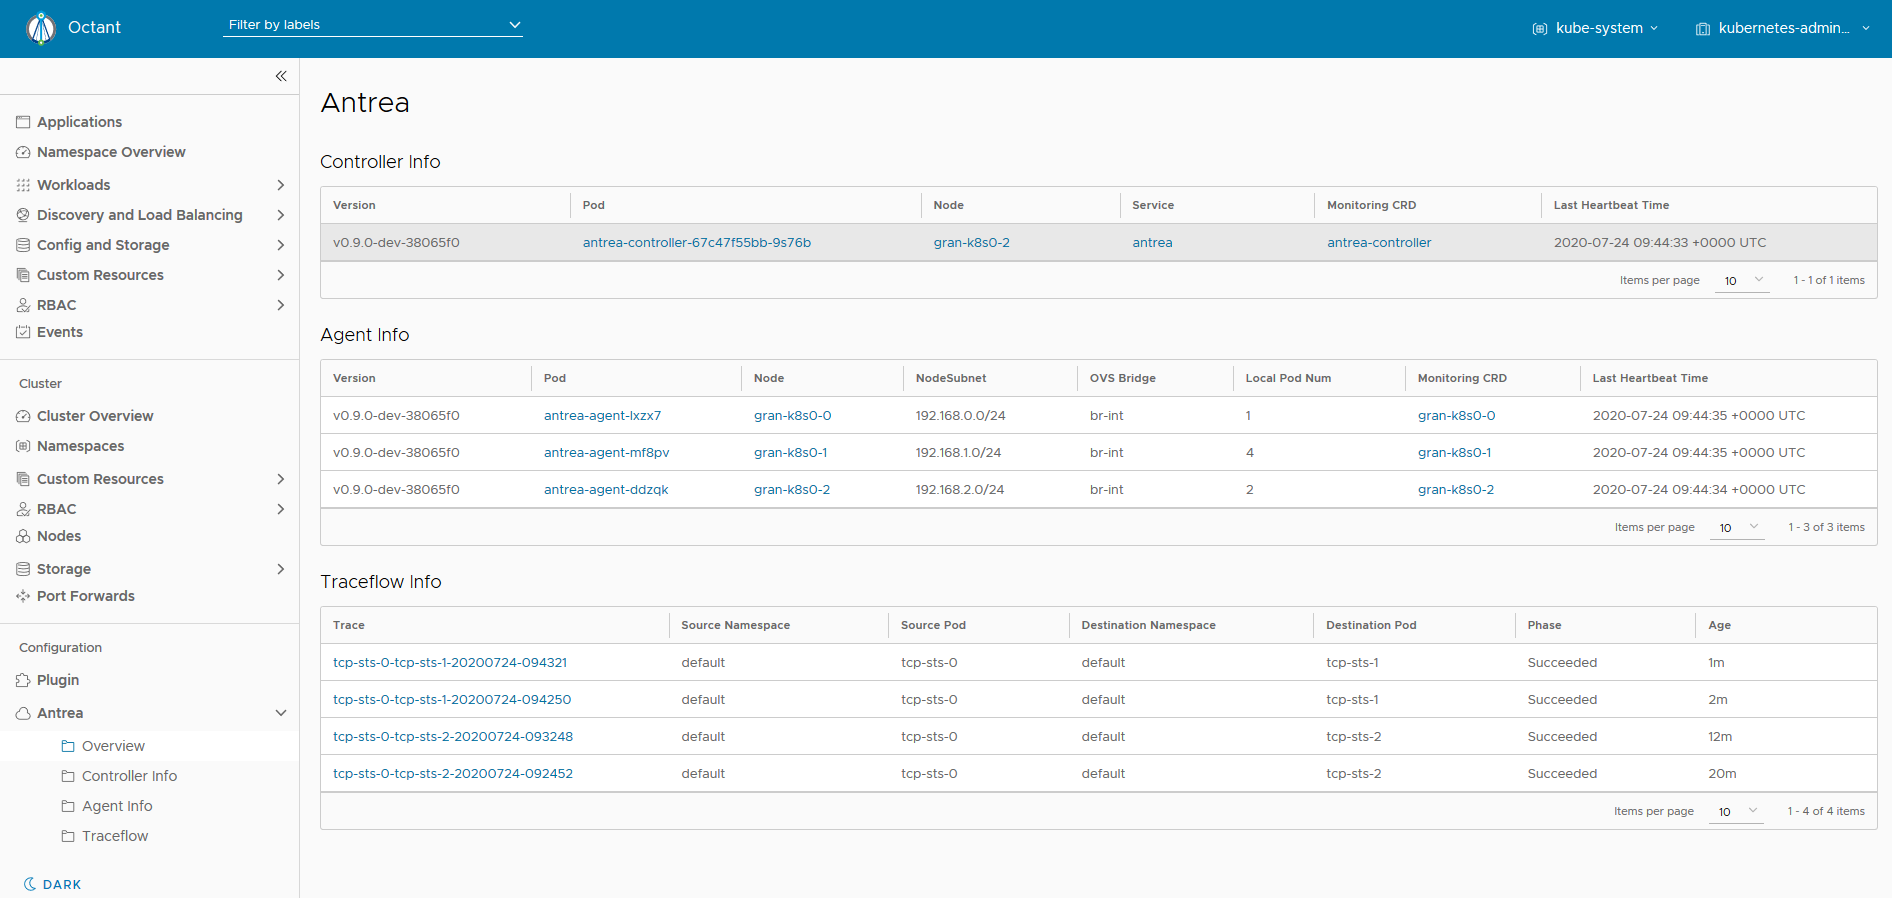
As shown above, you can check the existing Traceflow CRDs in the “Traceflow Info” table of the Antrea Overview web page in the Octant UI. You can generate a trace graph for any of these CRDs, as explained in the previous section. Also, you can view all the Traceflow CRDs from the Traceflow page by clicking the right tab named “Traceflow Info” like below.
RBAC
Traceflow CRDs are meant for admins to troubleshoot and diagnose the network
by injecting a packet from a source workload to a destination workload. Thus,
access to manage these CRDs must be granted to subjects which
have the authority to perform these diagnostic actions. On cluster
initialization, Antrea grants the permissions to edit these CRDs with admin
and the edit ClusterRole. In addition to this, Antrea also grants the
permission to view these CRDs with the view ClusterRole. Cluster admins can
therefore grant these ClusterRoles to any subject who may be responsible to
troubleshoot the network. The admins may also decide to share the view
ClusterRole to a wider range of subjects to allow them to read the traceflows
that are active in the cluster.